line graphs that indicate time along the x - axis can be used to predict what would happen to dependent…
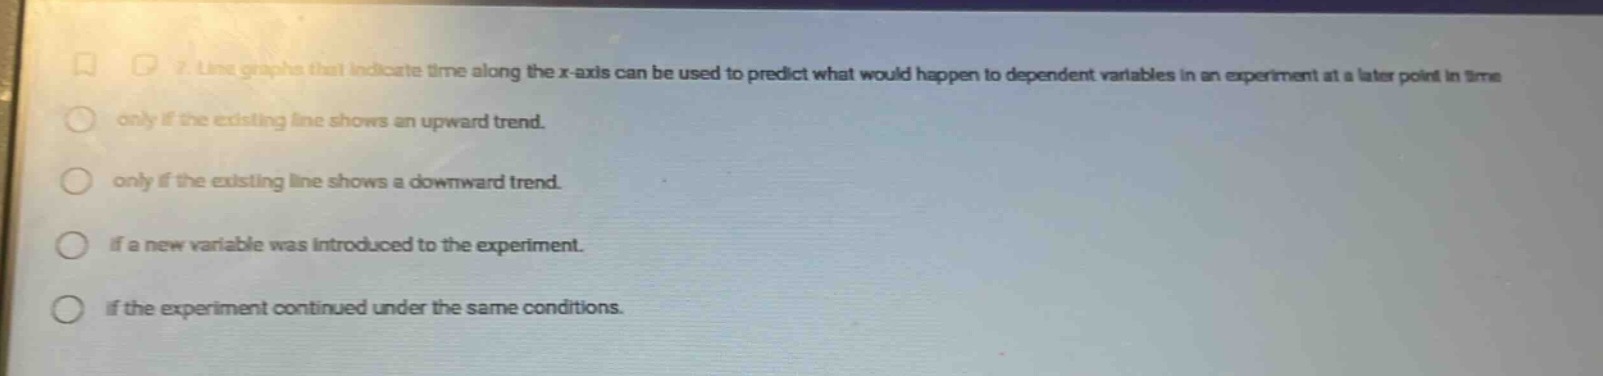
line graphs that indicate time along the x - axis can be used to predict what would happen to dependent variables in an experiment at a later point in time\nonly if the existing line shows an upward trend.\nonly if the existing line shows a downward trend.\nif a new variable was introduced to the experiment.\nif the experiment continued under the same conditions.
Answer
Brief Explanations:
Line - graphs with time on the x - axis can predict future values of dependent variables only when the experimental conditions remain the same. Trends (upward or downward) are not the sole determining factors, and introducing a new variable changes the experimental setup.
Answer:
If the experiment continued under the same conditions.