a software tester receives the following graphic. life cycle phases key design faults logic faults syntax…
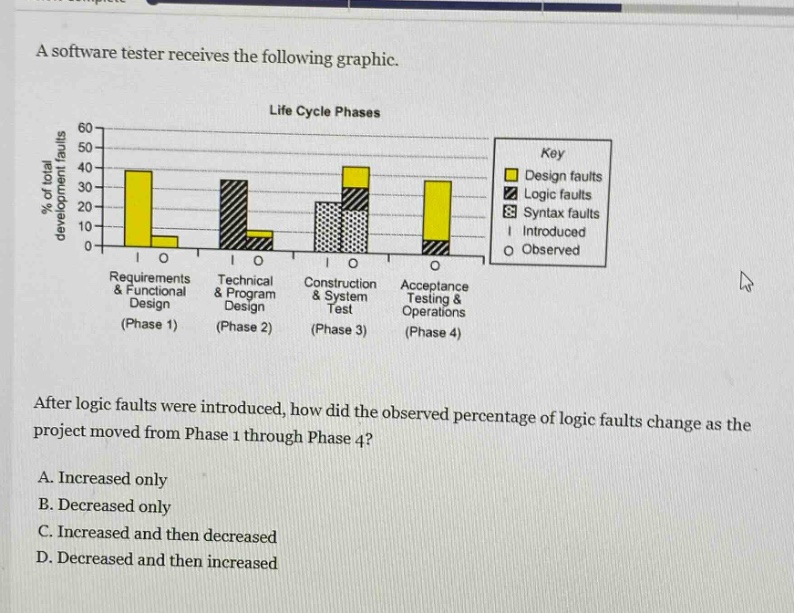
a software tester receives the following graphic. life cycle phases key design faults logic faults syntax faults introduced observed requirements & functional design (phase 1) technical & program design (phase 2) construction & system test (phase 3) acceptance testing & operations (phase 4) after logic faults were introduced, how did the observed percentage of logic faults change as the project moved from phase 1 through phase 4? a. increased only b. decreased only c. increased and then decreased d. decreased and then increased
Answer
Explanation:
Step1: Analyze Phase 1
In Phase 1 (Requirements & Functional Design), the percentage of observed logic - faults is 0.
Step2: Analyze Phase 2
In Phase 2 (Technical & Program Design), the percentage of observed logic - faults increases (non - zero value).
Step3: Analyze Phase 3
In Phase 3 (Construction & System Test), the percentage of observed logic - faults further increases compared to Phase 2.
Step4: Analyze Phase 4
In Phase 4 (Acceptance Testing & Operations), the percentage of observed logic - faults decreases compared to Phase 3.
Answer:
C. Increased and then decreased