the table shows the estimated number of lines of code written by computer programmers per hour when x people…
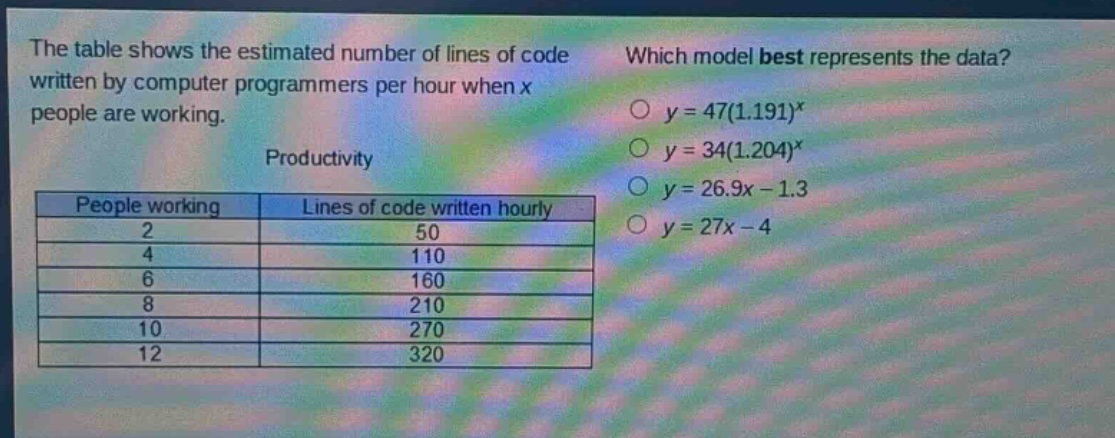
the table shows the estimated number of lines of code written by computer programmers per hour when x people are working.\nproductivity\n| people working | lines of code written hourly |\n| ---- | ---- |\n| 2 | 50 |\n| 4 | 110 |\n| 6 | 160 |\n| 8 | 210 |\n| 10 | 270 |\n| 12 | 320 |\nwhich model best represents the data?\n○ y = 47(1.191)^x\n○ y = 34(1.204)^x\n○ y = 26.9x - 1.3\n○ y = 27x - 4
Answer
Answer:
y = 26.9x - 1.3
Explanation:
Step1: Check linear - non - linear
The data seems to have a linear pattern as the increase in lines of code written hourly is somewhat consistent with the increase in people working. So we can rule out the exponential models (y = 47(1.191)^{x}) and (y = 34(1.204)^{x}).
Step2: Test linear models
For (y = 26.9x-1.3), when (x = 2), (y=26.9\times2 - 1.3=53.8 - 1.3 = 52.5) (close to 50). When (x = 4), (y=26.9\times4-1.3 = 107.6-1.3=106.3) (close to 110). For (y = 27x - 4), when (x = 2), (y=27\times2-4=54 - 4 = 50). When (x = 4), (y=27\times4-4=108 - 4 = 104) (less close to 110 compared to the first linear model). Overall, (y = 26.9x - 1.3) fits the data better.