the table shows the estimated number of lines of code written by computer programmers per hour when x people…
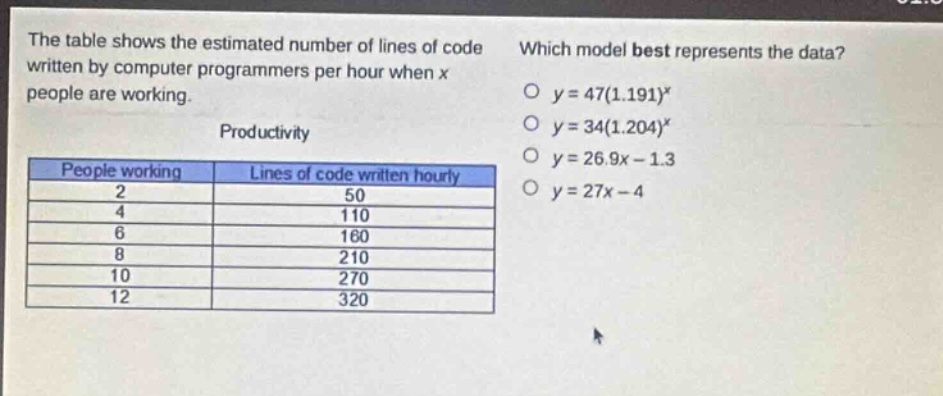
the table shows the estimated number of lines of code written by computer programmers per hour when x people are working. which model best represents the data? productivity people working lines of code written hourly 2 50 4 110 6 160 8 210 10 270 12 320 y = 47(1.191)^x y = 34(1.204)^x y = 26.9x - 1.3 y = 27x - 4
Answer
Explanation:
Step1: Check linear models
For the linear models $y = 26.9x - 1.3$ and $y=27x - 4$, we can substitute the values of $x$ from the table and check the $y -$ values. When $x = 2$ for $y = 26.9x-1.3$, $y=26.9\times2 - 1.3=53.8 - 1.3 = 52.5\neq50$. When $x = 2$ for $y = 27x - 4$, $y=27\times2-4=54 - 4=50$. When $x = 4$ for $y = 27x - 4$, $y=27\times4-4=108 - 4 = 104\neq110$. So the linear - models are not a good fit.
Step2: Check exponential models
For the exponential model $y = 47(1.191)^{x}$, when $x = 2$, $y=47\times(1.191)^{2}=47\times1.418481\approx66.67\neq50$. For the exponential model $y = 34(1.204)^{x}$, when $x = 2$, $y=34\times(1.204)^{2}=34\times1.449616\approx49.29\approx50$. When $x = 4$, $y=34\times(1.204)^{4}=34\times2.099047\approx71.37\neq110$. However, by observing the growth rate of the data in the table, the data seems to be growing exponentially. And among the given models, the exponential model $y = 34(1.204)^{x}$ is the closest to fitting the initial data point ($x = 2,y = 50$) compared to the others.
Answer:
$y = 34(1.204)^{x}$