the table shows the estimated number of lines of code written by computer programmers per hour when x people…
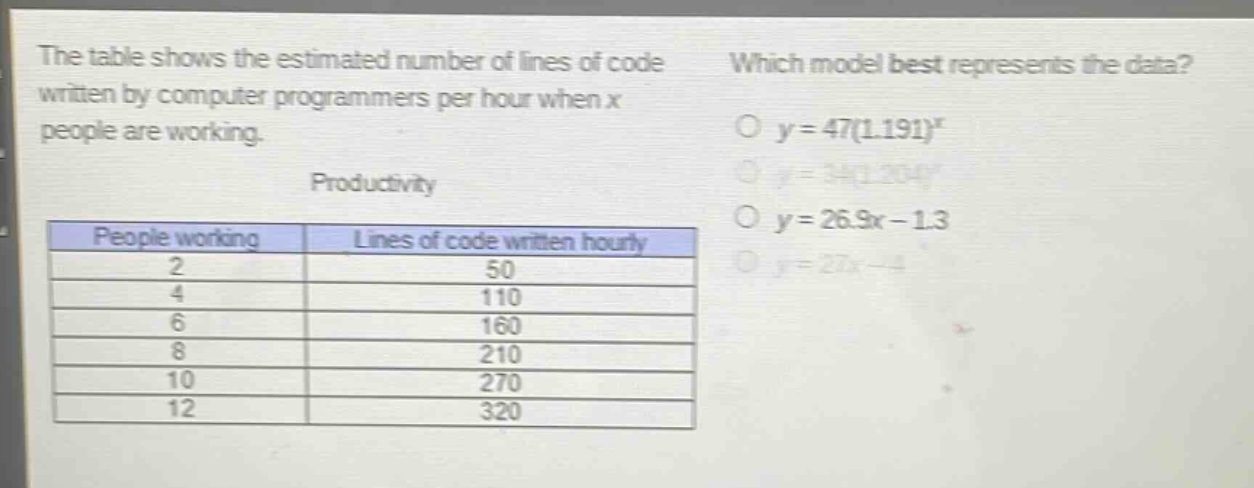
the table shows the estimated number of lines of code written by computer programmers per hour when x people are working.\nproductivity\n| people working | lines of code written hourly |\n| ---- | ---- |\n| 2 | 50 |\n| 4 | 110 |\n| 6 | 160 |\n| 8 | 210 |\n| 10 | 270 |\n| 12 | 320 |\nwhich model best represents the data?\no y = 47(1.191)^x\no y = 34(1.204)^x\no y = 26.9x - 1.3\no y = 27x - 4
Answer
Answer:
C. $y = 26.9x - 1.3$
Explanation:
Step1: Check linear - non - linear
The data seems to have a linear trend as the increase in the number of lines of code written hourly is relatively constant with the increase in the number of people working. So we can rule out the exponential models $y = 47(1.191)^x$ and $y=34(1.204)^x$.
Step2: Test linear models
For the linear model $y = 26.9x - 1.3$, when $x = 2$, $y=26.9\times2 - 1.3=53.8 - 1.3 = 52.5$ (close to 50). When $x = 4$, $y=26.9\times4-1.3 = 107.6 - 1.3=106.3$ (close to 110). For the linear model $y = 27x - 4$, when $x = 2$, $y=27\times2 - 4=54 - 4 = 50$, when $x = 4$, $y=27\times4-4=108 - 4 = 104$ (less close to 110 compared to the first linear model). So $y = 26.9x - 1.3$ is a better fit.