QUESTION IMAGE
Question
(03.01h lc)
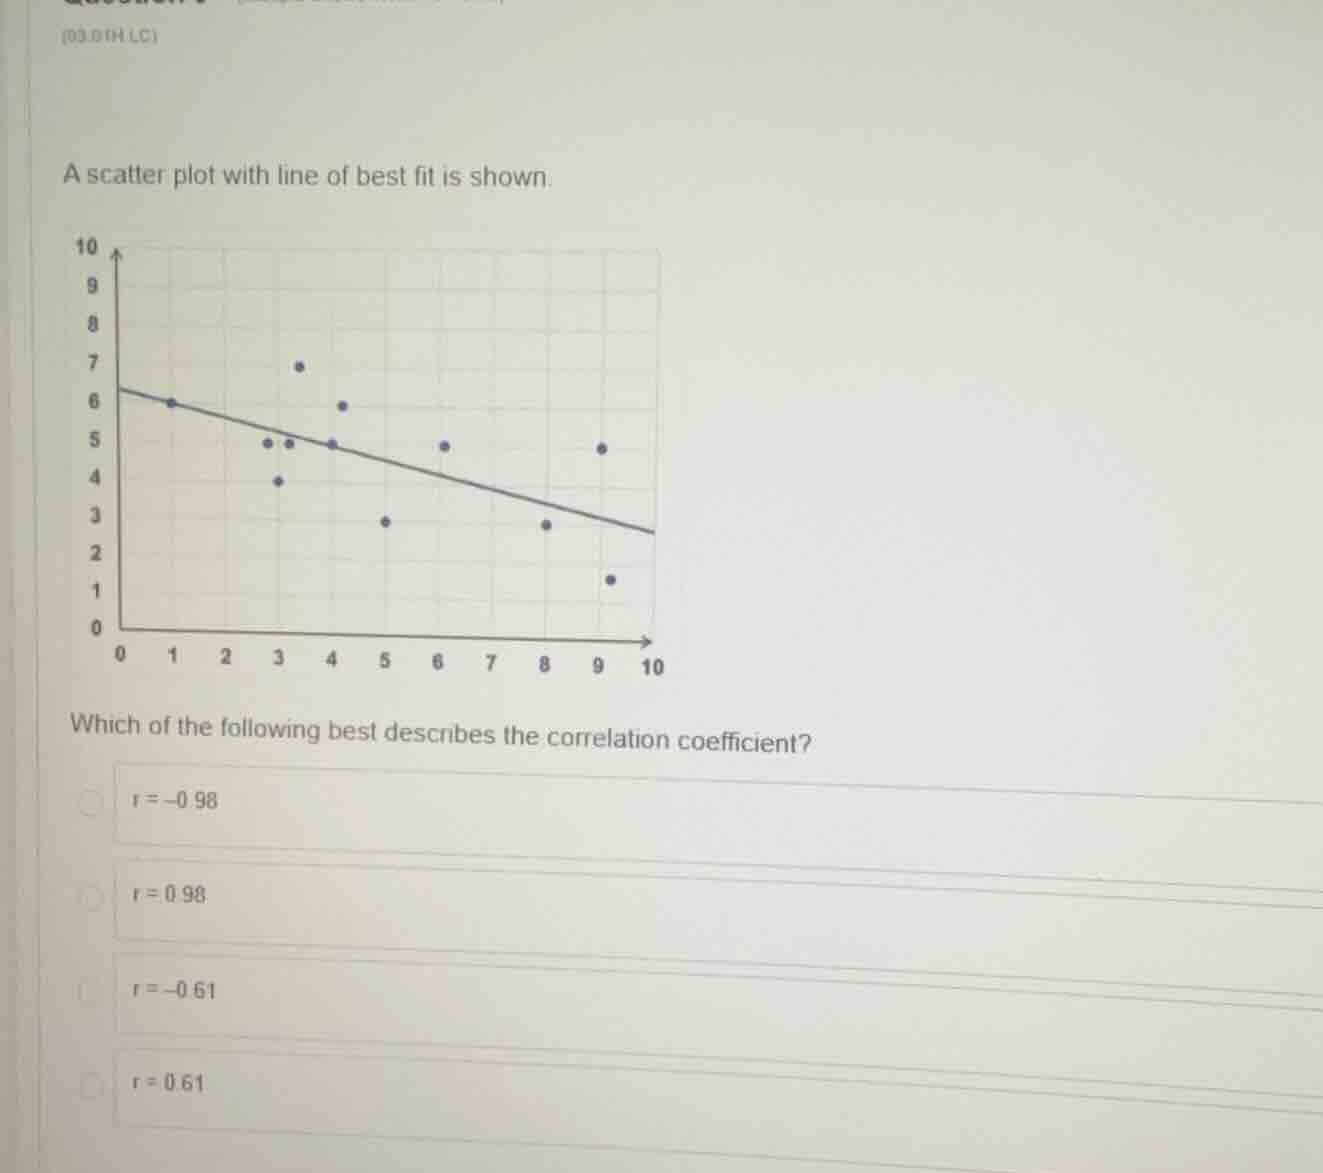
a scatter plot with line of best fit is shown.
which of the following best describes the correlation coefficient?
$r=-0.98$
$r=0.98$
$r=-0.61$
$r=0.61$
Step1: Identify correlation direction
The line of best fit slopes downward, so the correlation coefficient \(r\) is negative. This eliminates the positive options \(r=0.98\) and \(r=0.61\).
Step2: Assess correlation strength
The data points are not tightly clustered around the line of best fit; there is noticeable scatter. A value of \(r=-0.98\) would mean an extremely strong, near-perfect negative correlation (points almost on the line), which does not match the plot. A value of \(r=-0.61\) represents a moderate negative correlation, which fits the visible scatter.

Snap & solve any problem in the app
Get step-by-step solutions on Sovi AI
Photo-based solutions with guided steps
Explore more problems and detailed explanations
r = -0.61