QUESTION IMAGE
Question
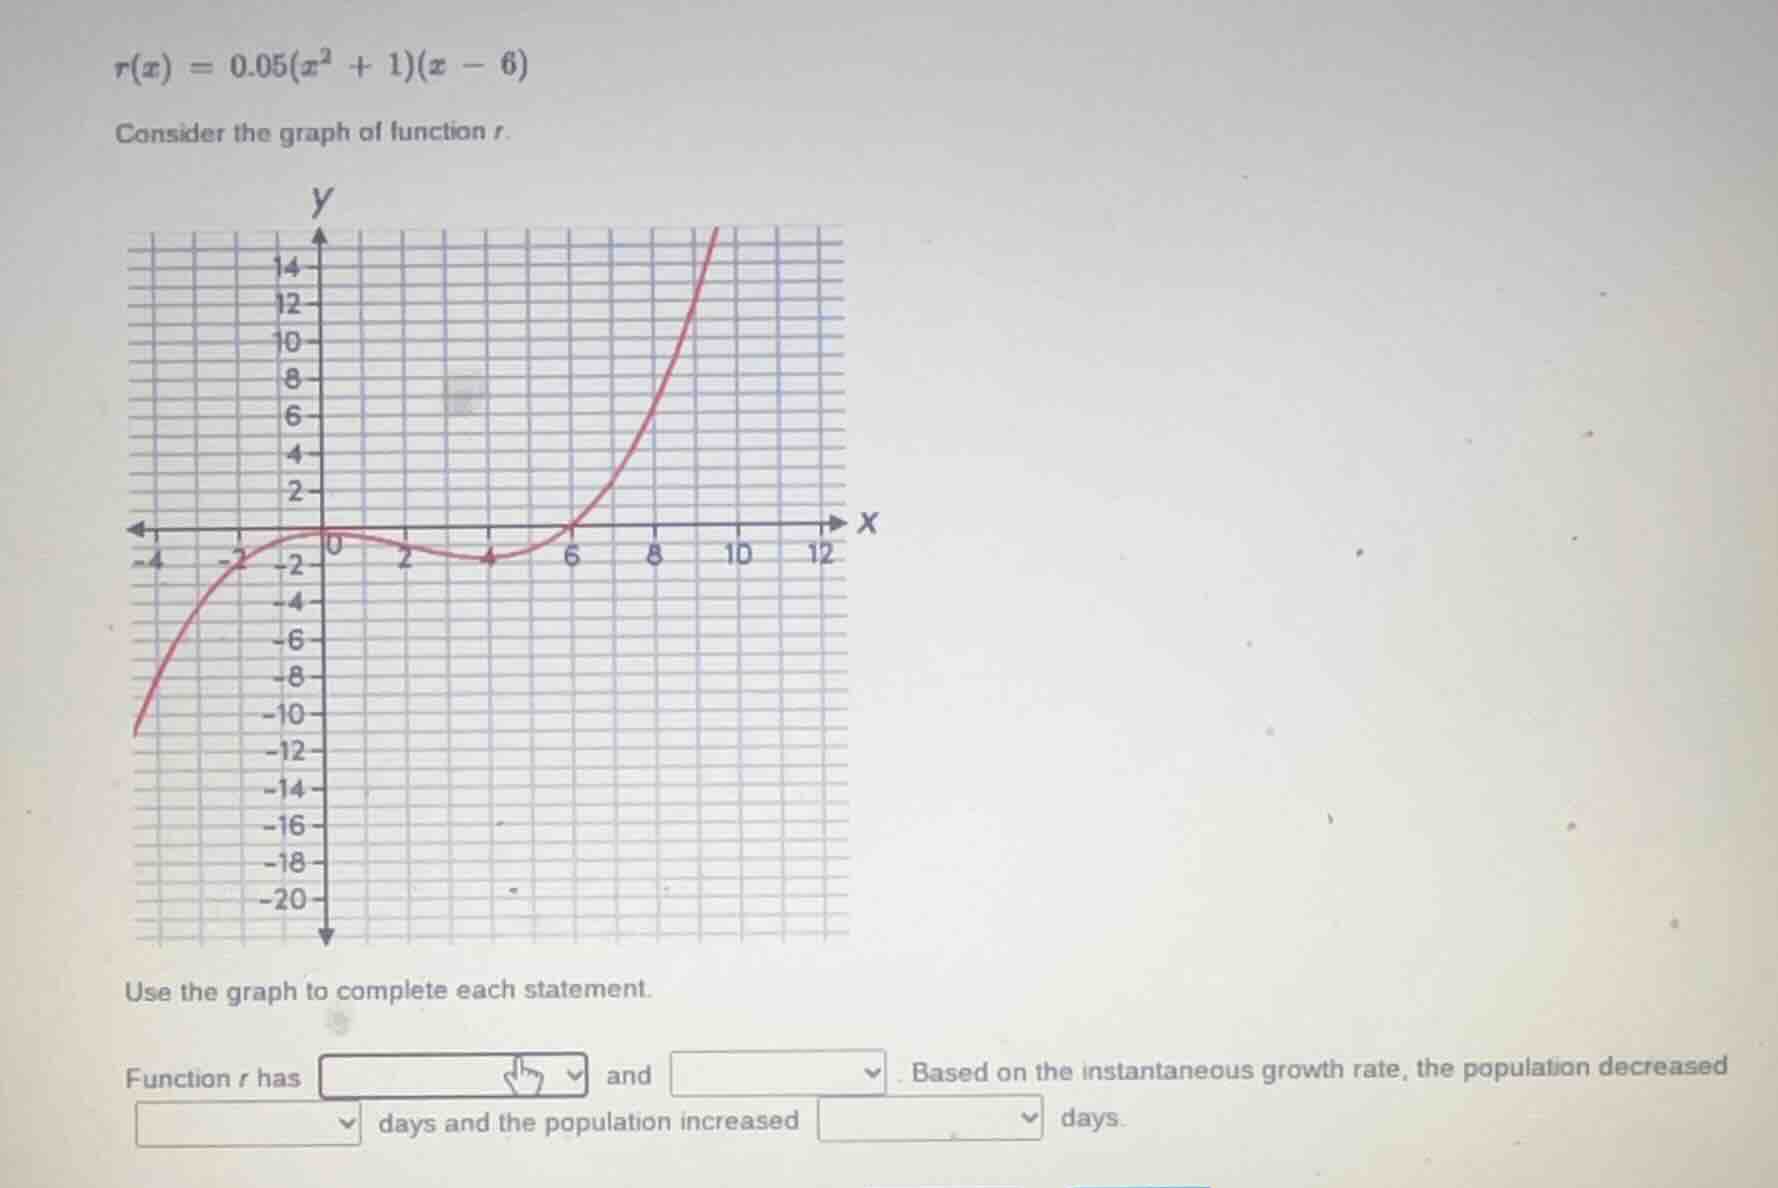
r(x) = 0.05(x² + 1)(x - 6)
consider the graph of function r.
use the graph to complete each statement.
function r has dropdown and dropdown. based on the instantaneous growth rate, the population decreased dropdown days and the population increased dropdown days.
Step1: Identify x-intercepts
From the graph, the function crosses the x-axis at $x=0$ and $x=6$.
Step2: Analyze sign of $r(x)$
When $0 < x < 6$, $r(x) < 0$ (population decreases, since growth rate is negative). When $x > 6$, $r(x) > 0$ (population increases, since growth rate is positive).
Step3: Identify extrema
The function has one local maximum at $x=0$ and one local minimum at $x=4$.

Snap & solve any problem in the app
Get step-by-step solutions on Sovi AI
Photo-based solutions with guided steps
Explore more problems and detailed explanations
Function $r$ has one local maximum and one local minimum. Based on the instantaneous growth rate, the population decreased 6 days and the population increased all days after 6 (or for values of $x > 6$) days.
To match the context of discrete days:
Function $r$ has one local maximum and one local minimum. Based on the instantaneous growth rate, the population decreased 6 days and the population increased indefinitely (or for all days beyond day 6) days.