QUESTION IMAGE
Question
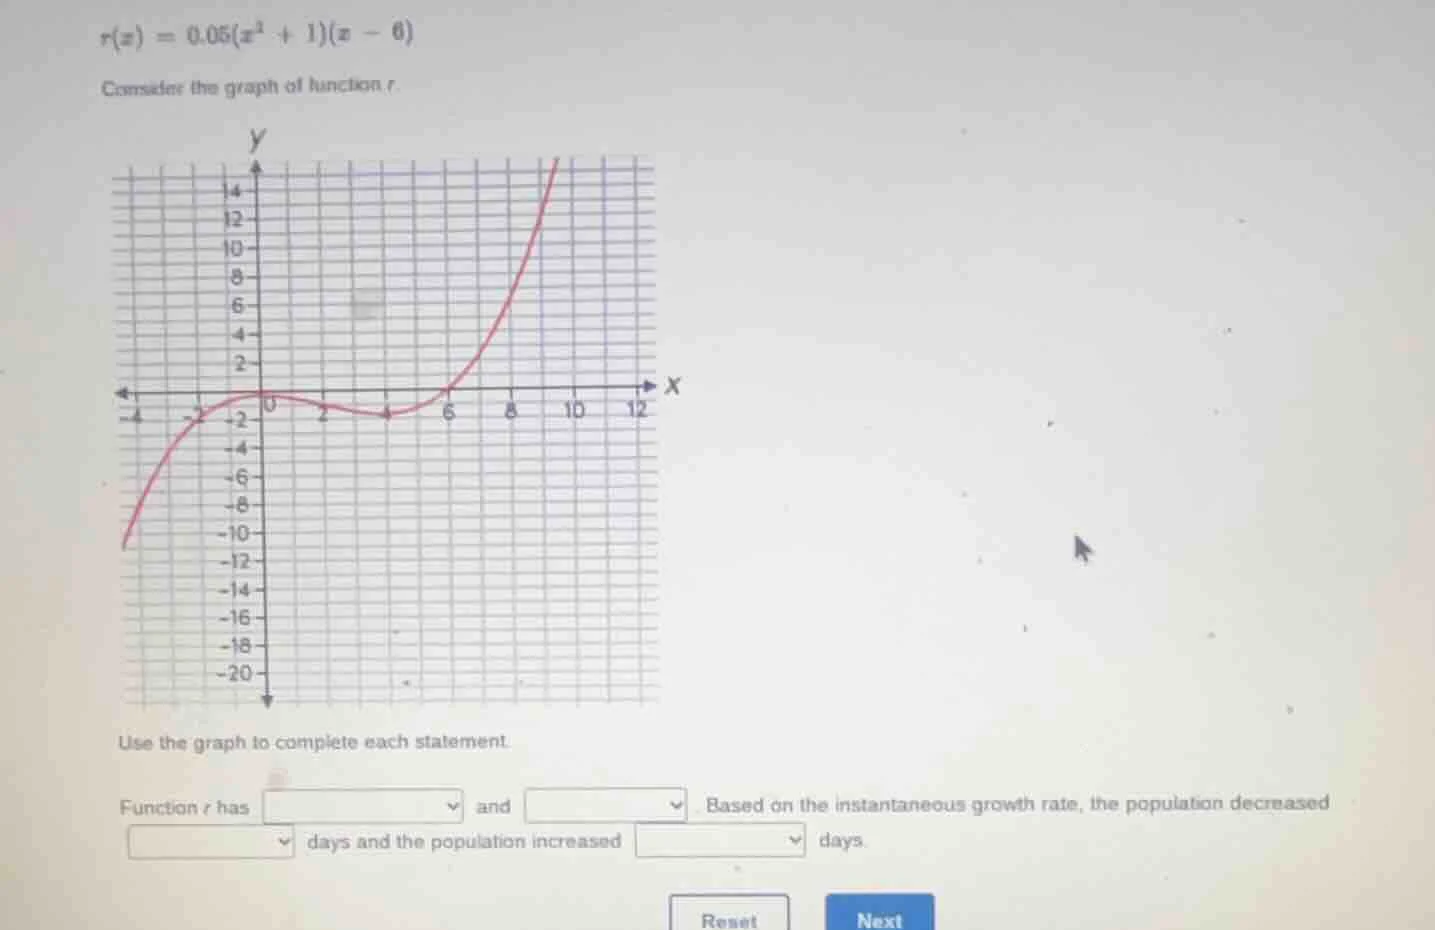
r(x) = 0.05(x^2 + 1)(x - 6)
consider the graph of function r.
use the graph to complete each statement.
function r has dropdown and dropdown. based on the instantaneous growth rate, the population decreased dropdown days and the population increased dropdown days.
Step1: Identify critical features
The function $r(x)=0.05(x^2+1)(x-6)$ is a cubic function. From the graph:
- It has a local maximum (peak) near $x=0$, and a local minimum (valley) near $x=4$.
- The graph is above the x-axis when $x>6$, and below the x-axis when $x<6$.
Step2: Match to population change
When $r(x)<0$, the instantaneous growth rate is negative, so population decreases. This occurs for $x<6$.
When $r(x)>0$, the instantaneous growth rate is positive, so population increases. This occurs for $x>6$.
Step3: Identify extrema types
The function has a local maximum (at $x=0$) and a local minimum (at $x=4$).

Snap & solve any problem in the app
Get step-by-step solutions on Sovi AI
Photo-based solutions with guided steps
Explore more problems and detailed explanations
Function $r$ has $\boldsymbol{\text{local maximum}}$ and $\boldsymbol{\text{local minimum}}$. Based on the instantaneous growth rate, the population decreased $\boldsymbol{\text{for the first 6}}$ days and the population increased $\boldsymbol{\text{after 6}}$ days.