QUESTION IMAGE
Question
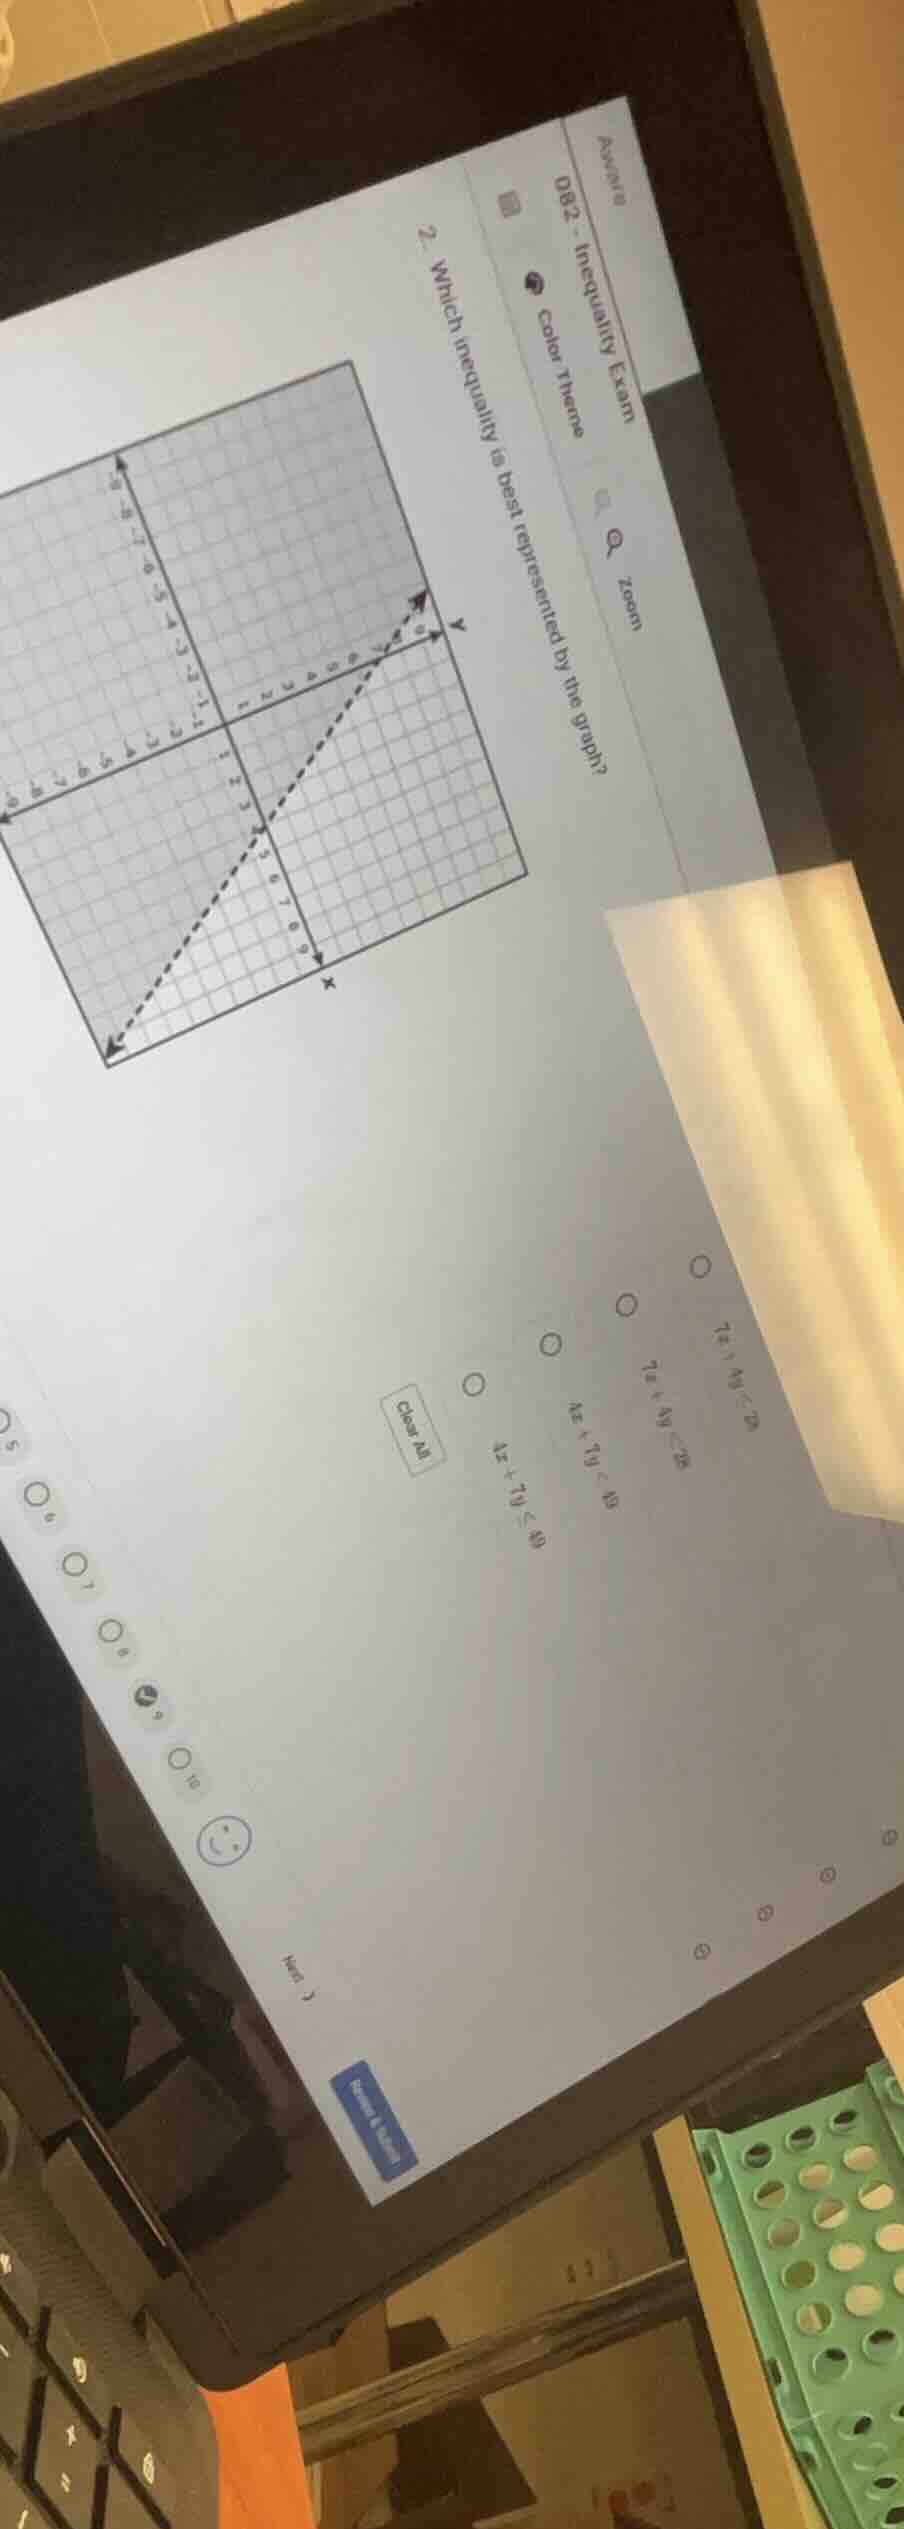
082 - inequality exam
- which inequality is best represented by the graph?
options: (some options related to linear inequalities like 7x + 4y < 28, 7x + 4y > 28, 4x + 7y < 49, 4x + 7y ≤ 49) (exact option text may have ocr errors due to image quality)
Step1: Find intercepts of the line
The dashed line has x-intercept $(7,0)$ and y-intercept $(0,4)$.
Step2: Derive the line equation
Use intercept form $\frac{x}{a}+\frac{y}{b}=1$, where $a=7$, $b=4$.
$\frac{x}{7}+\frac{y}{4}=1$
Multiply by 28: $4x + 7y = 28$
Step3: Determine inequality sign
The graph is a dashed line (strict inequality) and the shaded region is below the line, so use $<$.
Step4: Match to options
The inequality is $4x + 7y < 28$.

Snap & solve any problem in the app
Get step-by-step solutions on Sovi AI
Photo-based solutions with guided steps
Explore more problems and detailed explanations
$4x + 7y < 28$