QUESTION IMAGE
Question
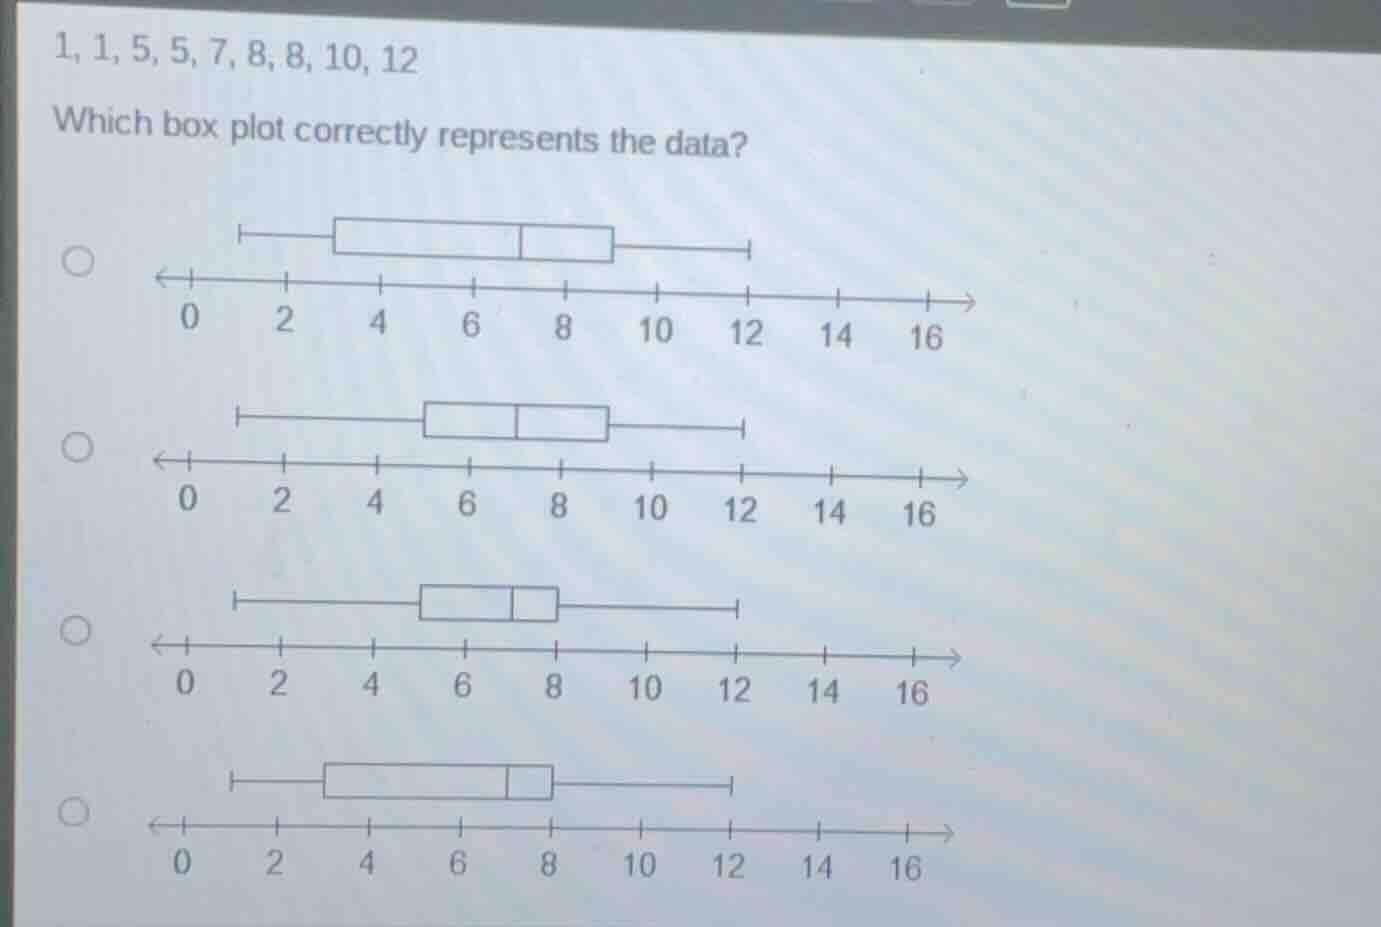
1, 1, 5, 5, 7, 8, 8, 10, 12
which box plot correctly represents the data?
options with box plots on number lines from 0 to 16 (as shown in the image)
Step1: Identify min, max values
Minimum = 1, Maximum = 12
Step2: Calculate median (2nd quartile)
Data sorted: 1,1,5,5,7,8,8,10,12.
Median = 5th value = 7
Step3: Calculate Q1 (1st quartile)
Lower half: 1,1,5,5. Q1 = $\frac{1+5}{2}=3$
Step4: Calculate Q3 (3rd quartile)
Upper half: 8,8,10,12. Q3 = $\frac{8+10}{2}=9$
Step5: Match to box plot
Box plot has whiskers at 1 and 12, box edges at 3 and 9, median line at 7.

Snap & solve any problem in the app
Get step-by-step solutions on Sovi AI
Photo-based solutions with guided steps
Explore more problems and detailed explanations
The first box plot (topmost option, with whiskers from 1 to 12, box from 3 to 9, median at 7)