QUESTION IMAGE
Question
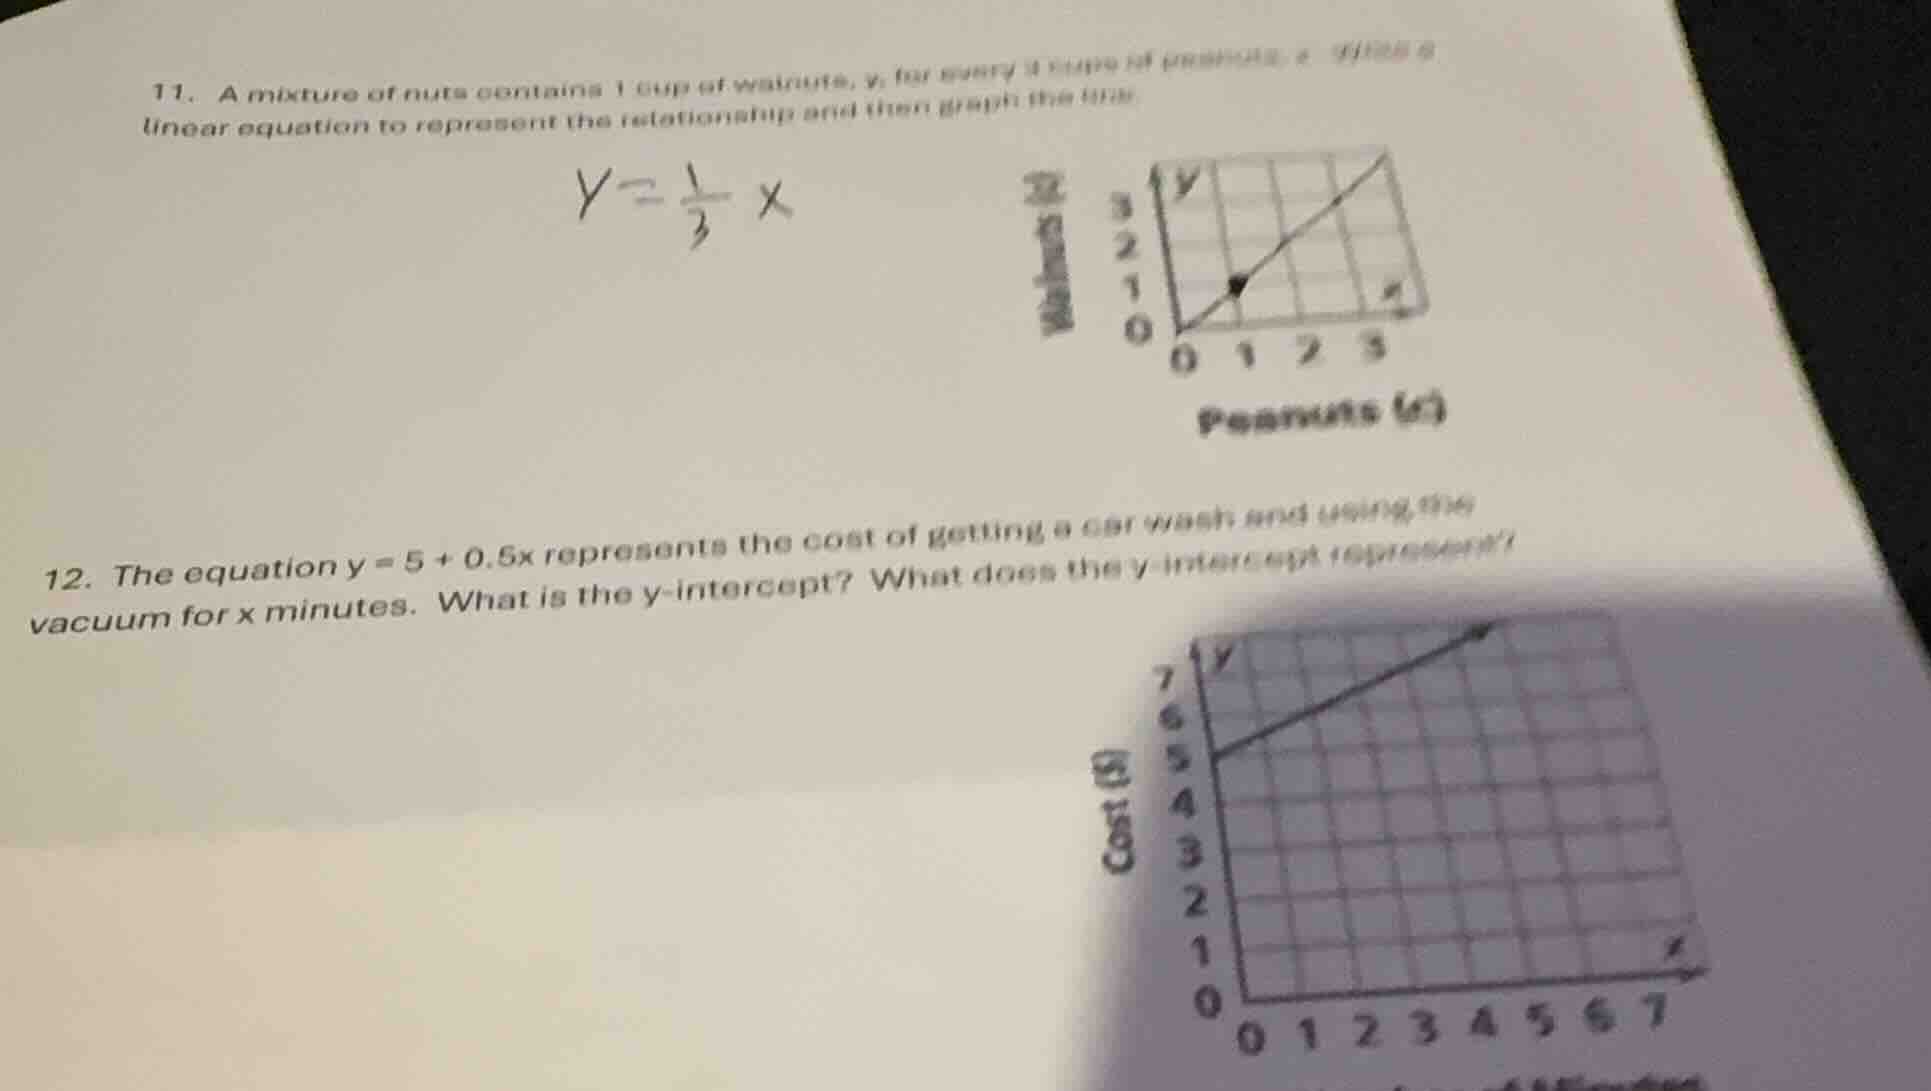
- a mixture of nuts contains 1 cup of walnuts, y, for every 3 cups of peanuts, x. write a linear equation to represent the relationship and then graph the line.
$y = \frac{1}{3}x$
- the equation $y = 5 + 0.5x$ represents the cost of getting a car wash and using the vacuum for x minutes. what is the y - intercept? what does the y - intercept represent?
Problem 12
Step1: Recall slope - intercept form
The slope - intercept form of a linear equation is $y = mx + b$, where $m$ is the slope and $b$ is the $y$-intercept.
Step2: Identify the $y$-intercept from the equation
Given the equation $y=5 + 0.5x$, comparing it with $y=mx + b$, we can see that $b = 5$.
Step3: Interpret the $y$-intercept
In the context of the problem, $y$ represents the cost of getting a car wash and using the vacuum for $x$ minutes. When $x = 0$ (i.e., we use the vacuum for 0 minutes), the value of $y$ is 5. So the $y$-intercept (5) represents the cost of just getting the car wash (without using the vacuum at all).
Step1: Analyze the relationship
We know that for every 3 cups of peanuts ($x$), there is 1 cup of walnuts ($y$). So the ratio of walnuts to peanuts is $\frac{y}{x}=\frac{1}{3}$, which can be rewritten as $y=\frac{1}{3}x$.
Step2: Check the graph
To graph $y = \frac{1}{3}x$, we can use the slope - intercept form. The slope $m=\frac{1}{3}$ and the $y$-intercept $b = 0$. When $x = 0$, $y = 0$ (the origin). When $x = 3$, $y=\frac{1}{3}\times3 = 1$. When $x = 6$, $y=\frac{1}{3}\times6=2$, and so on. The given graph has points like (0,0), (3,1), (6,2) etc., which lie on the line $y=\frac{1}{3}x$, so the graph is correct for the equation $y = \frac{1}{3}x$.

Snap & solve any problem in the app
Get step-by-step solutions on Sovi AI
Photo-based solutions with guided steps
Explore more problems and detailed explanations
The $y$-intercept is 5. The $y$-intercept represents the cost of getting a car wash (when the time spent using the vacuum $x = 0$ minutes).