QUESTION IMAGE
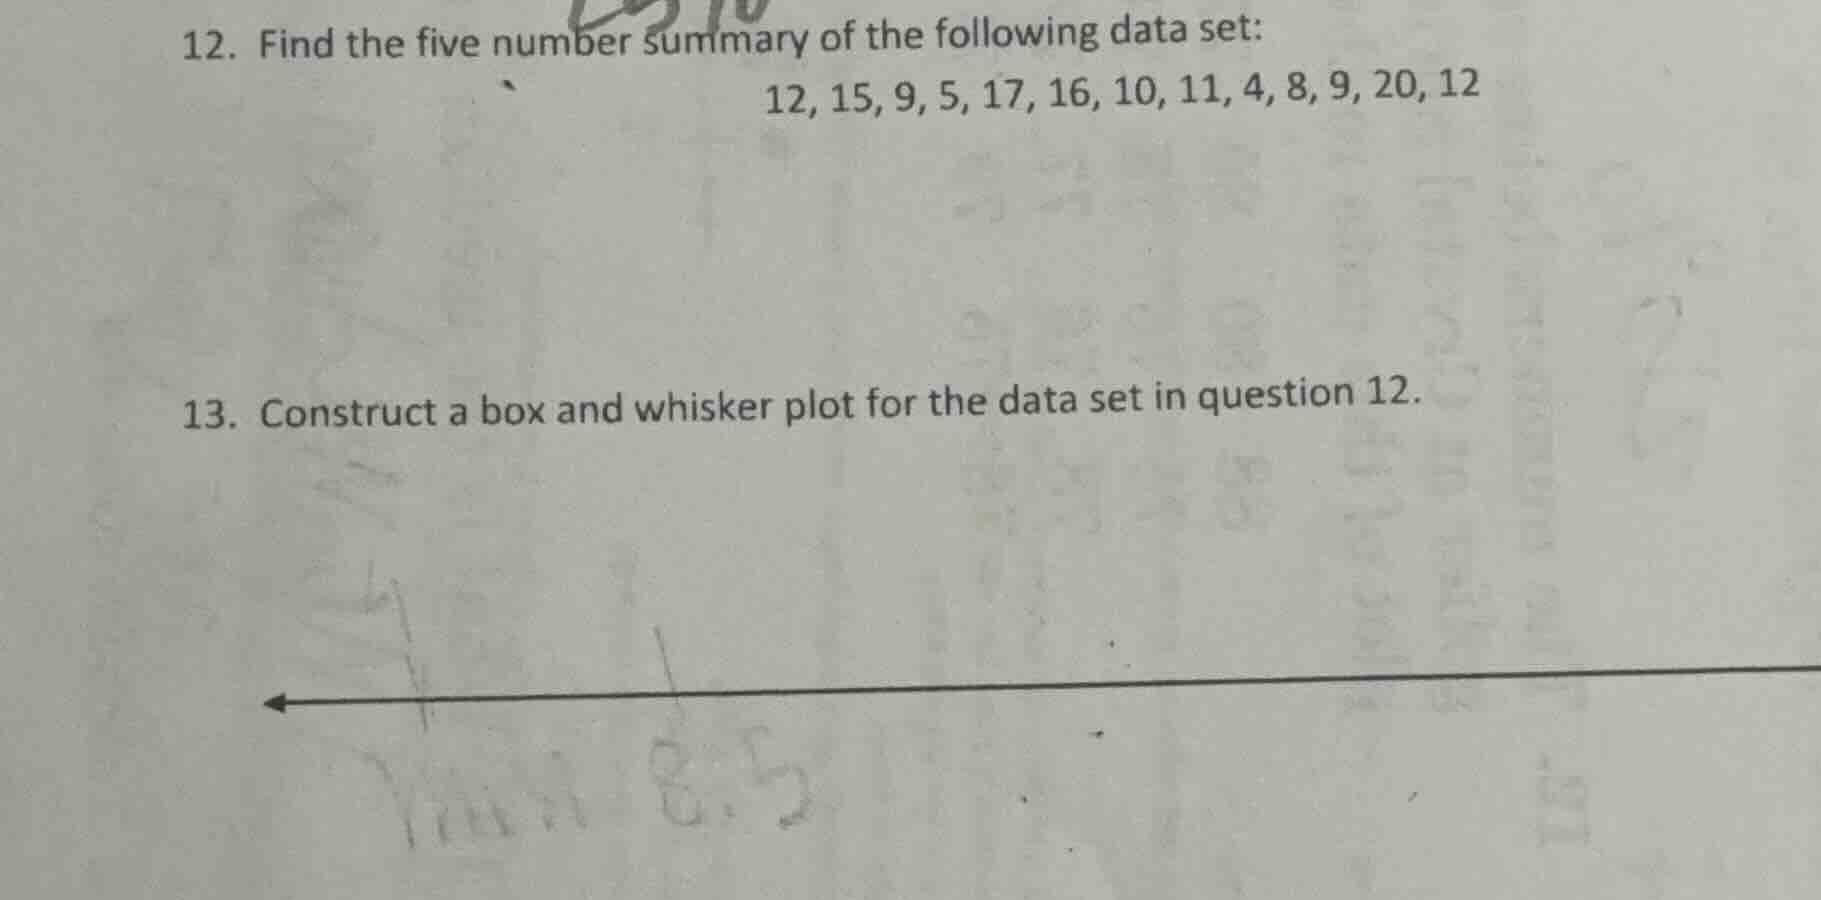
Question
- find the five number summary of the following data set:
12, 15, 9, 5, 17, 16, 10, 11, 4, 8, 9, 20, 12
- construct a box and whisker plot for the data set in question 12.
Question 12 Solution:
Step1: Order the data set
First, we need to sort the data set in ascending order. The given data set is: \(12, 15, 9, 5, 17, 16, 10, 11, 4, 8, 9, 20, 12\). After sorting, we get: \(4, 5, 8, 9, 9, 10, 11, 12, 12, 15, 16, 17, 20\).
Step2: Find the minimum value
The minimum value is the smallest number in the sorted data set. From the sorted data, the minimum value is \(4\).
Step3: Find the first quartile (\(Q_1\))
The first quartile is the median of the lower half of the data. The number of data points \(n = 13\), which is odd. The lower half of the data (excluding the median) is the first \(\frac{n - 1}{2}=6\) numbers: \(4, 5, 8, 9, 9, 10\). The median of this lower half is the average of the 3rd and 4th numbers (since there are 6 numbers, an even count). The 3rd number is \(8\) and the 4th number is \(9\). So, \(Q_1=\frac{8 + 9}{2}=\frac{17}{2} = 8.5\).
Step4: Find the median (second quartile, \(Q_2\))
The median is the middle number of the sorted data set. Since \(n = 13\), the median is the \(\frac{13 + 1}{2}=7\)th number. From the sorted data, the 7th number is \(11\). So, the median \(Q_2 = 11\).
Step5: Find the third quartile (\(Q_3\))
The third quartile is the median of the upper half of the data. The upper half of the data (excluding the median) is the last \(\frac{n - 1}{2}=6\) numbers: \(12, 12, 15, 16, 17, 20\). The median of this upper half is the average of the 3rd and 4th numbers. The 3rd number is \(15\) and the 4th number is \(16\). So, \(Q_3=\frac{15 + 16}{2}=\frac{31}{2}=15.5\).
Step6: Find the maximum value
The maximum value is the largest number in the sorted data set. From the sorted data, the maximum value is \(20\).
To construct a box - and - whisker plot, we use the five - number summary from question 12: Minimum \(=4\), \(Q_1 = 8.5\), Median \(=11\), \(Q_3=15.5\), Maximum \( = 20\).
- Draw a number line that covers the range of the data (from \(4\) to \(20\) in this case).
- Plot the minimum (\(4\)) and maximum (\(20\)) values as the endpoints of the whiskers.
- Draw a box from \(Q_1 = 8.5\) to \(Q_3=15.5\). Inside the box, draw a vertical line at the median value (\(11\)).

Snap & solve any problem in the app
Get step-by-step solutions on Sovi AI
Photo-based solutions with guided steps
Explore more problems and detailed explanations
The five - number summary is: Minimum \( = 4\), \(Q_1=8.5\), Median (\(Q_2\)) \( = 11\), \(Q_3 = 15.5\), Maximum \( = 20\)