QUESTION IMAGE
Question
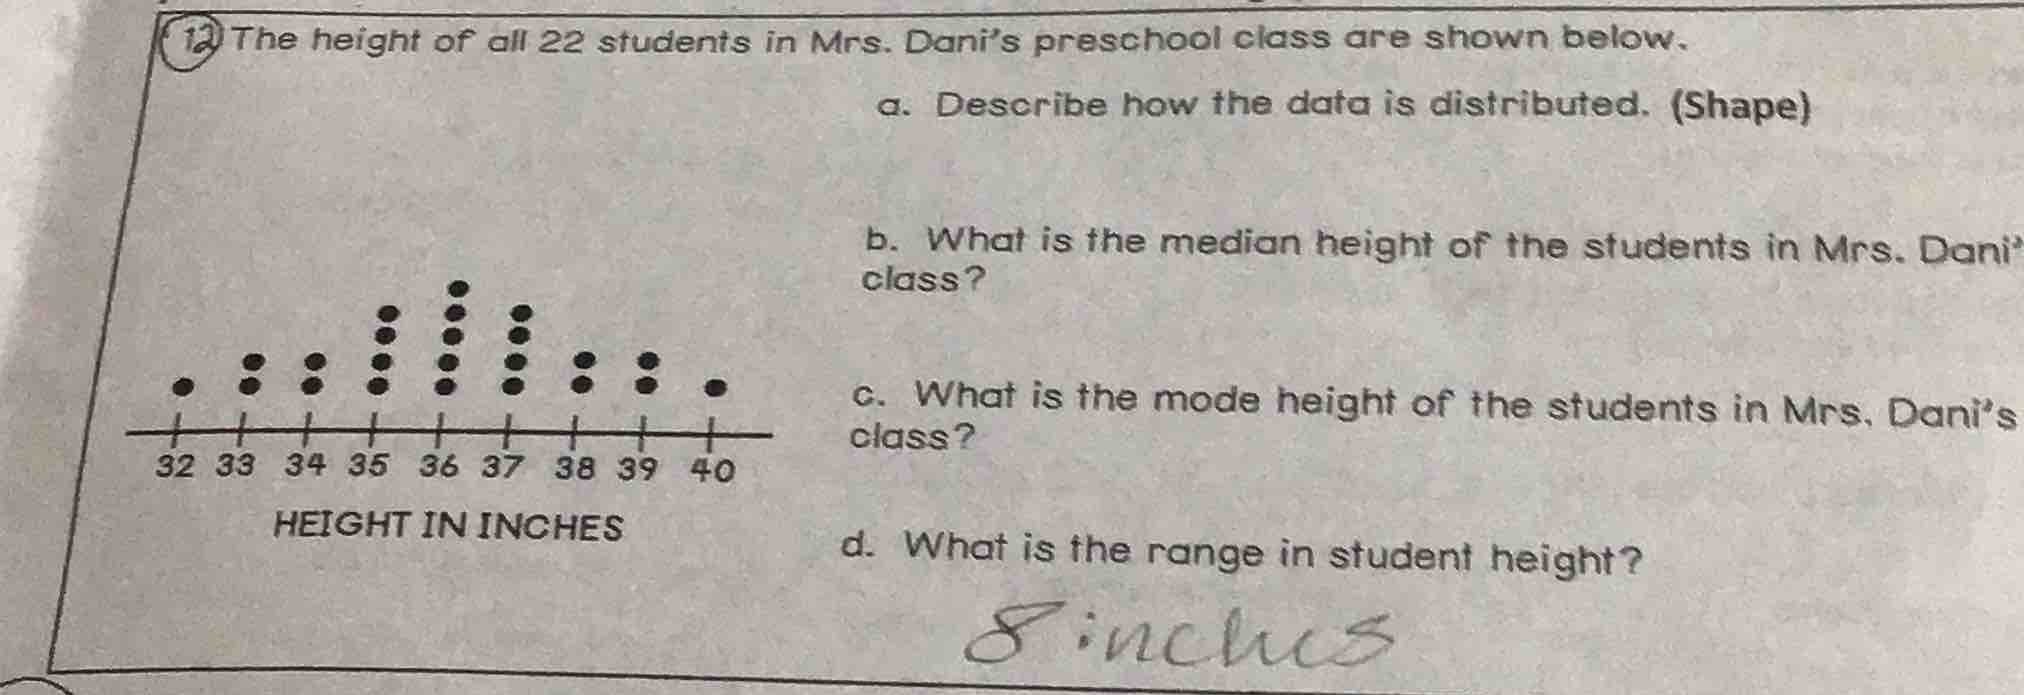
12 the height of all 22 students in mrs. dani’s preschool class are shown below.
a. describe how the data is distributed. (shape)
b. what is the median height of the students in mrs. dani’ class?
c. what is the mode height of the students in mrs. dani’s class?
d. what is the range in student height?
8 inches
Step1: Contar datos por altura
Alturas y cantidad de estudiantes:
32: 1, 33: 2, 34: 2, 35: 3, 36: 4, 37: 3, 38: 2, 39: 2, 40: 1
Step2: Analizar forma de distribución
La distribución tiene el pico en el centro (36 pulgadas) y es simétrica: los valores a la izquierda y derecha del pico tienen la misma frecuencia.
Step3: Calcular la mediana
Hay 22 datos, la mediana es el promedio del 11° y 12° dato. Ordenando los datos, el 11° y 12° valor son ambos 36.
$\text{Mediana} = \frac{36 + 36}{2} = 36$
Step4: Identificar la moda
La moda es el valor con mayor frecuencia, que es 36 (4 estudiantes).
Step5: Calcular el rango
Rango = Valor máximo - Valor mínimo
$\text{Rango} = 40 - 32 = 8$

Snap & solve any problem in the app
Get step-by-step solutions on Sovi AI
Photo-based solutions with guided steps
Explore more problems and detailed explanations
a. La distribución es simétrica (simétrica alrededor del valor central 36 pulgadas).
b. 36 pulgadas
c. 36 pulgadas
d. 8 pulgadas