QUESTION IMAGE
Question
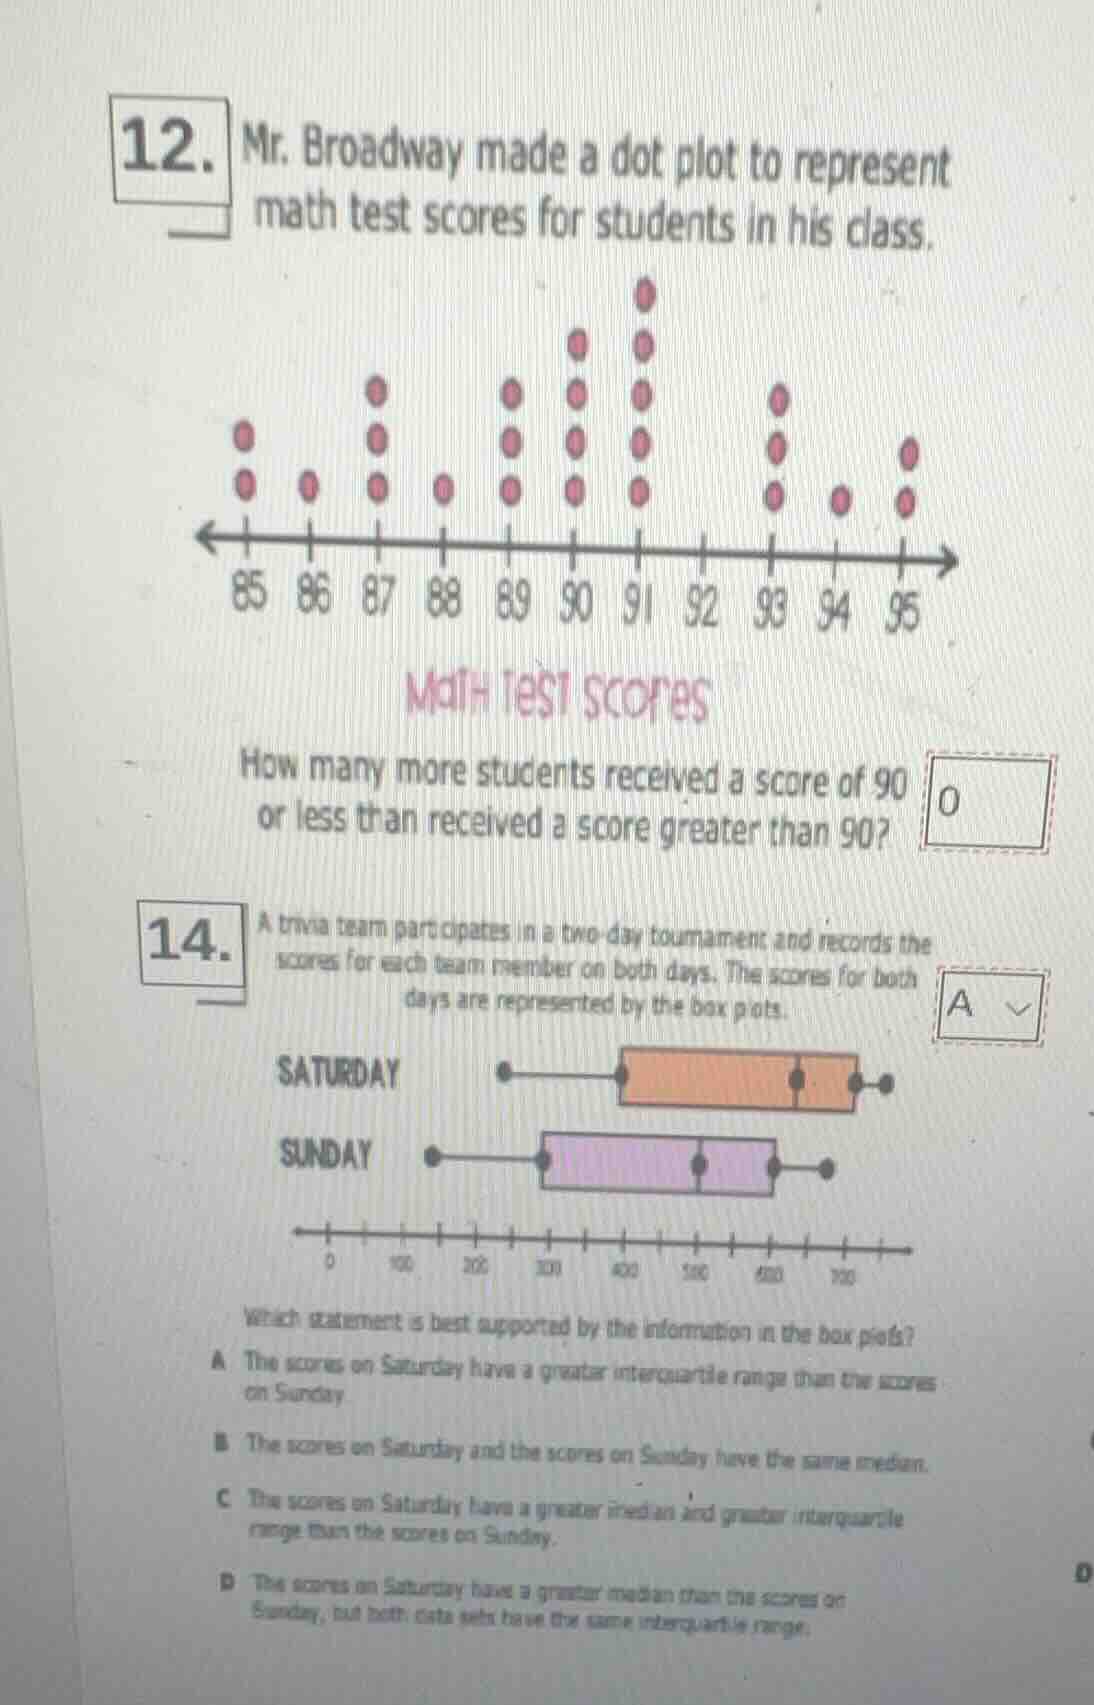
- mr. broadway made a dot plot to represent math test scores for students in his class.
math test scores
how many more students received a score of 90 or less than received a score greater than 90?
- a trivia team participates in a two - day tournament and records the scores for each team member on both days. the scores for both days are represented by the box plots.
saturday
sunday
which statement is best supported by the information in the box plots?
a the scores on saturday have a greater interquartile range than the scores on sunday.
b the scores on saturday and the scores on sunday have the same median.
c the scores on saturday have a greater median and greater interquartile range than the scores on sunday.
d the scores on saturday have a greater median than the scores on sunday, but both data sets have the same interquartile range.
Question 12
Step1: Count students with score ≤90
Scores: 85 (2), 86 (1), 87 (3), 88 (1), 89 (3), 90 (4).
Total: \( 2 + 1 + 3 + 1 + 3 + 4 = 14 \).
Step2: Count students with score >90
Scores: 91 (5), 93 (3), 94 (1), 95 (2), 92 (0).
Total: \( 5 + 3 + 1 + 2 + 0 = 11 \).
Step3: Find the difference
Subtract: \( 14 - 11 = 3 \). Wait, but the original box has 0—maybe miscalculation? Wait, recheck:
85: 2, 86:1 (total 3), 87:3 (6), 88:1 (7), 89:3 (10), 90:4 (14).
90: 91 (5), 93 (3), 94 (1), 95 (2), 92 (0). 5+3=8, +1=9, +2=11. 14-11=3. But the original answer was 0—maybe the dot plot was misread. Wait, maybe the user’s original 0 is incorrect, but following the process:
Wait, maybe the dot plot: 85 (2), 86 (1), 87 (3), 88 (1), 89 (3), 90 (4), 91 (5), 92 (0), 93 (3), 94 (1), 95 (2).
≤90: 2+1+3+1+3+4=14. >90:5+3+1+2=11. 14-11=3. But the user’s box had 0—maybe a typo. Assuming the process, the difference is 3. But if the original answer was 0, maybe misinterpretation. Alternatively, maybe “90 or less” includes 90, “greater than 90” is 91+, 92,93,94,95. Wait 92 has 0 dots. So 91:5, 93:3, 94:1, 95:2. Total 5+3+1+2=11. ≤90:14. 14-11=3. So the answer should be 3. But the user’s box had 0—maybe error.
Question 14
- Interquartile Range (IQR): Width of the box (Q3 - Q1).
- Median: Line inside the box.
- Option A: Saturday’s box is wider? No, maybe same or Sunday wider? Wait, the box plots: Saturday’s box (orange) and Sunday’s (purple). If the median (line) of Saturday is right of Sunday’s, and IQR: if the boxes’ width (IQR) is same, and median of Saturday > Sunday.
- Option D: “Greater median than Sunday, same IQR.” Let’s analyze:
- Median (line): Saturday’s median is right (higher) than Sunday’s.
- IQR: If the box widths (Q3 - Q1) are equal (same length), then IQR is same.
So D is correct.

Snap & solve any problem in the app
Get step-by-step solutions on Sovi AI
Photo-based solutions with guided steps
Explore more problems and detailed explanations
s:
- \(\boldsymbol{3}\) (Note: Original 0 may be incorrect; recheck dot plot.)
- D. The scores on Saturday have a greater median than the scores on Sunday, but both data sets have the same interquartile range.