QUESTION IMAGE
Question
13.
domain:
range:
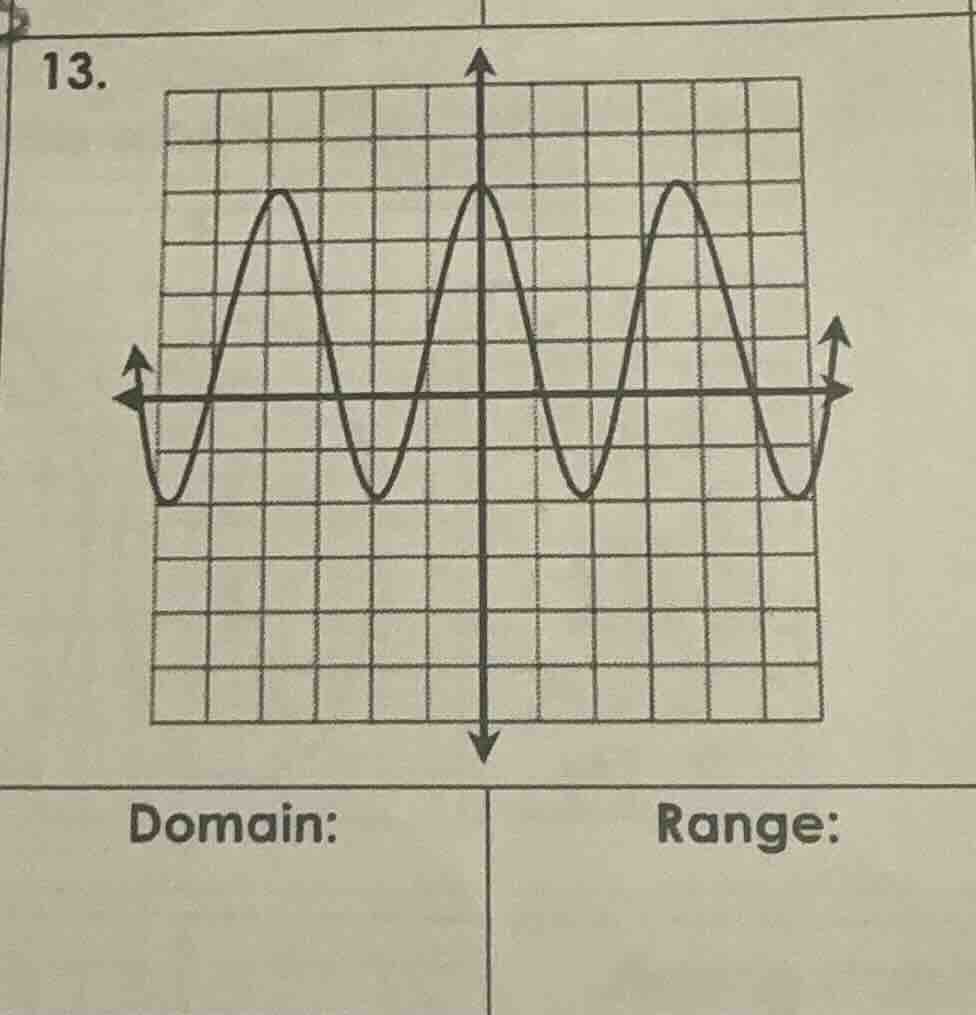
Step1: Determine the domain
The graph extends infinitely to the left and right along the x - axis (as indicated by the arrows). For a function represented by this graph, the domain is all real numbers because there are no restrictions on the x - values that the function can take. In interval notation, the set of all real numbers is $(-\infty, \infty)$.
Step2: Determine the range
To find the range, we look at the vertical extent of the graph. The graph has a minimum value (the lowest point it reaches) and a maximum value (the highest point it reaches). From the graph, we can see that the minimum y - value is some constant (let's assume the lowest point is at $y = -k$ where $k>0$) and the maximum y - value is at $y = k$ (since it's symmetric about the x - axis? Wait, no, looking at the graph, it's symmetric about the y - axis? Wait, actually, the graph oscillates between a minimum and a maximum. From the grid, we can see that the lowest point is, say, at $y=-2$ (assuming the grid lines are 1 unit apart) and the highest point is at $y = 2$? Wait, no, let's re - examine. The graph has a minimum value (the bottom of the troughs) and a maximum value (the top of the peaks). The range is the set of all y - values that the function can take. So the range is from the minimum y - value to the maximum y - value, inclusive. If we assume that the minimum y - value is, for example, $y=-2$ and the maximum is $y = 2$, but actually, looking at the graph, the vertical extent: the troughs are at a certain y - level and the peaks at another. Wait, more accurately, the graph is a periodic function (like a cosine - type function) that oscillates between a minimum and maximum. The domain of a function is all real numbers when the graph extends infinitely left and right. For the range, since the graph goes from a minimum y - value (let's say $y = - 2$) up to a maximum y - value (let's say $y=2$), but actually, from the graph, the lowest point is, for example, at $y=-2$ (if we count the grid lines) and the highest at $y = 2$. Wait, no, looking at the graph, the vertical distance from the x - axis to the peak is, say, 2 units (assuming each grid square is 1 unit). So the range is all real numbers between the minimum and maximum y - values, inclusive. So if the minimum y is $-2$ and maximum is $2$, the range is $[-2,2]$. But actually, from the graph, we can see that the function's output (y - values) range from the minimum (the bottom of the valleys) to the maximum (the top of the hills). So the range is the set of y - values such that $-2\leq y\leq2$ (assuming the grid is 1 unit per square, and the lowest point is 2 units below the x - axis and the highest is 2 units above).

Snap & solve any problem in the app
Get step-by-step solutions on Sovi AI
Photo-based solutions with guided steps
Explore more problems and detailed explanations
Domain: $(-\infty, \infty)$
Range: $[-2, 2]$ (assuming the vertical distance from the x - axis to the peak/trough is 2 units; if the grid has different scaling, adjust accordingly, but the general form is the set of all y - values between the minimum and maximum of the graph)