QUESTION IMAGE
Question
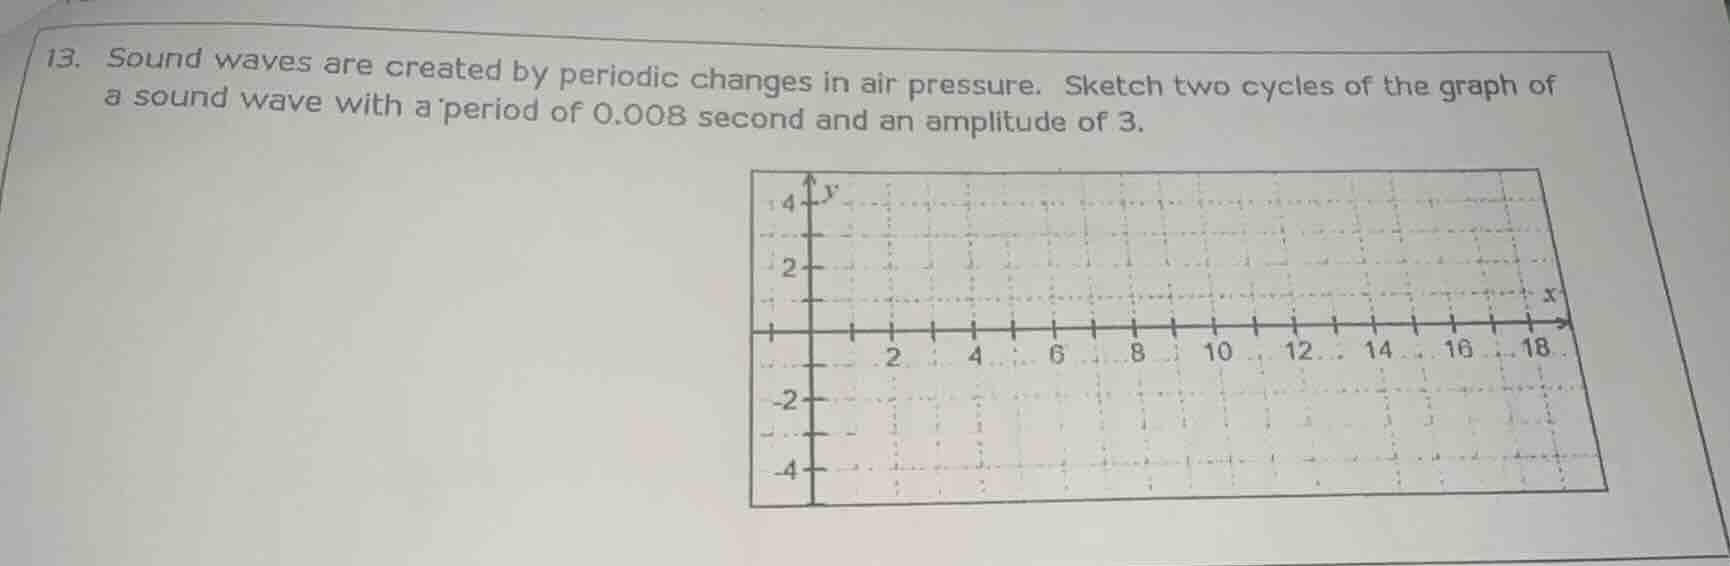
- sound waves are created by periodic changes in air pressure. sketch two cycles of the graph of a sound wave with a period of 0.008 second and an amplitude of 3.
Step1: Recall the general form of a sinusoidal function
The general form of a sinusoidal function is \( y = A\sin(Bx) \) or \( y = A\cos(Bx) \), where \( A \) is the amplitude and the period \( T=\frac{2\pi}{|B|} \).
Given the amplitude \( A = 3 \) and the period \( T=0.008 \) seconds. First, we find \( B \). Since \( T=\frac{2\pi}{|B|} \), we can solve for \( B \):
\( |B|=\frac{2\pi}{T}=\frac{2\pi}{0.008}=\frac{2\pi}{\frac{8}{1000}}=\frac{2\pi\times1000}{8} = 250\pi \)
So we can use the function \( y = 3\sin(250\pi x) \) (we could also use cosine, but sine is a common choice for starting at the origin for a wave).
Step2: Determine the x - range for two cycles
The period \( T = 0.008 \) seconds. For two cycles, the total length along the x - axis (time axis) will be \( 2T=2\times0.008 = 0.016 \) seconds.
Step3: Identify key points for one cycle
For a sine function \( y = 3\sin(250\pi x) \):
- At \( x = 0 \), \( y=3\sin(0)=0 \)
- At \( x=\frac{T}{4}=\frac{0.008}{4}=0.002 \) seconds, \( y = 3\sin(250\pi\times0.002)=3\sin(0.5\pi)=3\times1 = 3 \) (maximum amplitude)
- At \( x=\frac{T}{2}=\frac{0.008}{2}=0.004 \) seconds, \( y = 3\sin(250\pi\times0.004)=3\sin(\pi)=0 \)
- At \( x=\frac{3T}{4}=\frac{3\times0.008}{4}=0.006 \) seconds, \( y = 3\sin(250\pi\times0.006)=3\sin(1.5\pi)=3\times(- 1)=-3 \) (minimum amplitude)
- At \( x = T=0.008 \) seconds, \( y = 3\sin(250\pi\times0.008)=3\sin(2\pi)=0 \)
For the second cycle (from \( x = 0.008 \) to \( x = 0.016 \)):
- At \( x = 0.008 \), \( y = 0 \) (same as \( x = 0 \) for the first cycle)
- At \( x=0.008 + 0.002=0.010 \) seconds, \( y = 3 \)
- At \( x=0.008+0.004 = 0.012 \) seconds, \( y = 0 \)
- At \( x=0.008 + 0.006=0.014 \) seconds, \( y=-3 \)
- At \( x = 0.016 \) seconds, \( y = 0 \)
Step4: Sketch the graph
- On the given coordinate system (assuming the x - axis is in seconds and the y - axis is the pressure deviation with amplitude 3), we plot the points:
- For the first cycle (\( 0\leq x\leq0.008 \)): (0,0), (0.002,3), (0.004,0), (0.006, - 3), (0.008,0)
- For the second cycle (\( 0.008\leq x\leq0.016 \)): (0.008,0), (0.010,3), (0.012,0), (0.014, - 3), (0.016,0)
Then we connect these points with a smooth sinusoidal curve. The y - axis has a range from - 4 to 4, which is suitable since our amplitude is 3 (so the maximum y - value is 3 and the minimum is - 3, which is within the given y - axis range of - 4 to 4). The x - axis should be scaled such that 0 to 0.016 seconds is covered. If we assume the x - axis grid in the given graph has each major grid line (e.g., at x = 2,4,6,...) representing a certain time unit, we need to adjust the scale. But conceptually, the graph of \( y = 3\sin(250\pi x) \) over the interval \( [0,0.016] \) will have two full cycles, starting at the origin, going up to 3, down to - 3, and repeating.

Snap & solve any problem in the app
Get step-by-step solutions on Sovi AI
Photo-based solutions with guided steps
Explore more problems and detailed explanations
To sketch the graph:
- Use the sinusoidal function \( y = 3\sin(250\pi x) \) (or \( y = 3\cos(250\pi x-\frac{\pi}{2}) \) for a cosine - based start).
- Plot key points for two cycles:
- First cycle (\( 0\leq x\leq0.008 \)): \((0,0)\), \((0.002,3)\), \((0.004,0)\), \((0.006, - 3)\), \((0.008,0)\)
- Second cycle (\( 0.008\leq x\leq0.016 \)): \((0.008,0)\), \((0.010,3)\), \((0.012,0)\), \((0.014, - 3)\), \((0.016,0)\)
- Connect the points with a smooth, periodic (sinusoidal) curve. The curve will have a maximum y - value of 3, a minimum y - value of - 3, a period of 0.008 seconds, and will span 0.016 seconds (two cycles) along the x - axis.