QUESTION IMAGE
Question
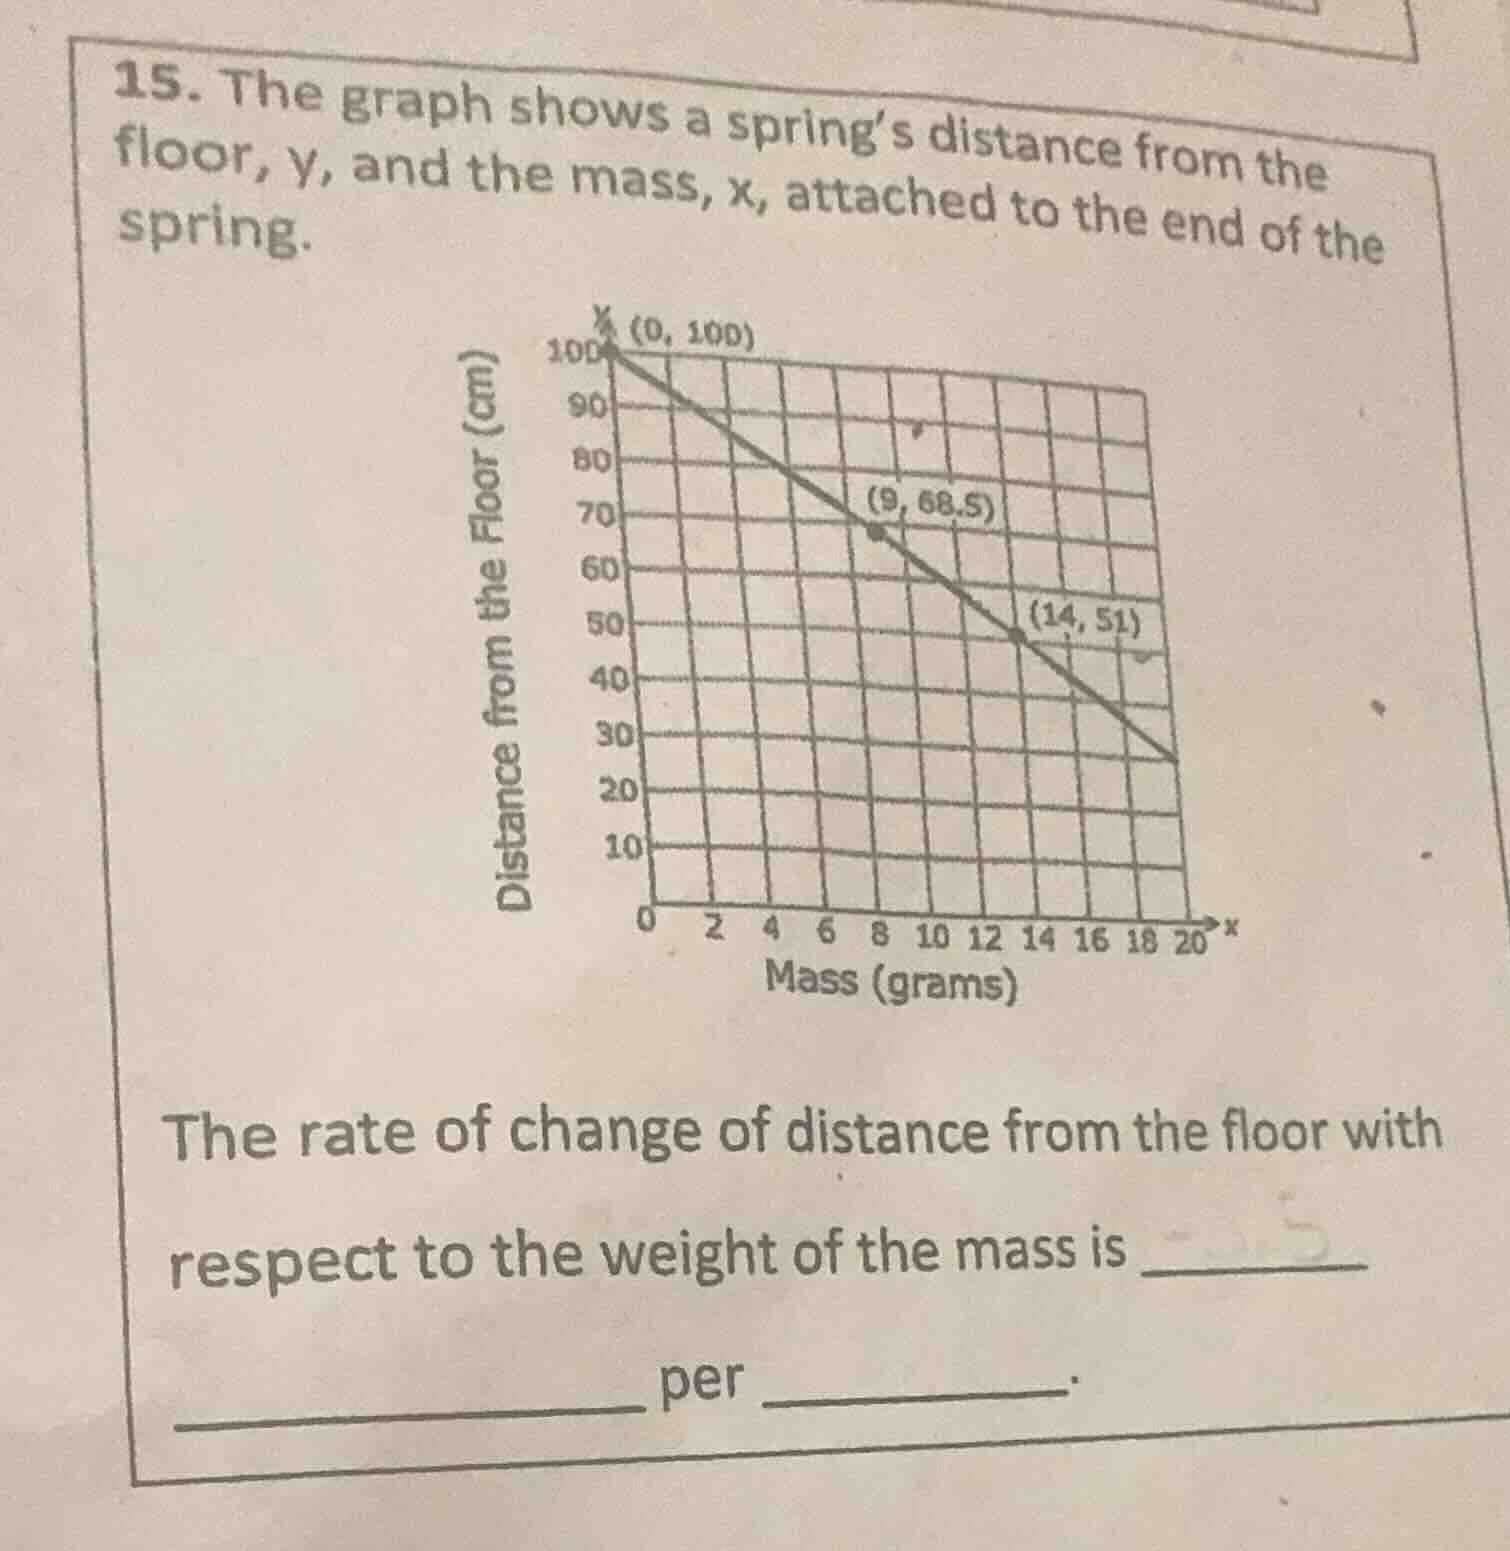
- the graph shows a spring’s distance from the floor, y, and the mass, x, attached to the end of the spring. the rate of change of distance from the floor with respect to the weight of the mass is ____ per ____.
Step1: Identify two points
We can use the points \((0, 100)\) and \((14, 51)\) (or other two points on the line). The formula for the rate of change (slope) is \(m=\frac{y_2 - y_1}{x_2 - x_1}\).
Let \((x_1,y_1)=(0, 100)\) and \((x_2,y_2)=(14, 51)\).
Step2: Calculate the slope
Substitute into the slope formula: \(m=\frac{51 - 100}{14 - 0}=\frac{- 49}{14}=- 3.5\).
This means the rate of change of distance from the floor (\(y\)) with respect to the mass (\(x\)) is \(-3.5\) centimeters per gram. The negative sign indicates that as the mass increases, the distance from the floor decreases.

Snap & solve any problem in the app
Get step-by-step solutions on Sovi AI
Photo-based solutions with guided steps
Explore more problems and detailed explanations
\(-3.5\) centimeters per gram (or \(-\frac{7}{2}\) centimeters per gram)