QUESTION IMAGE
Question
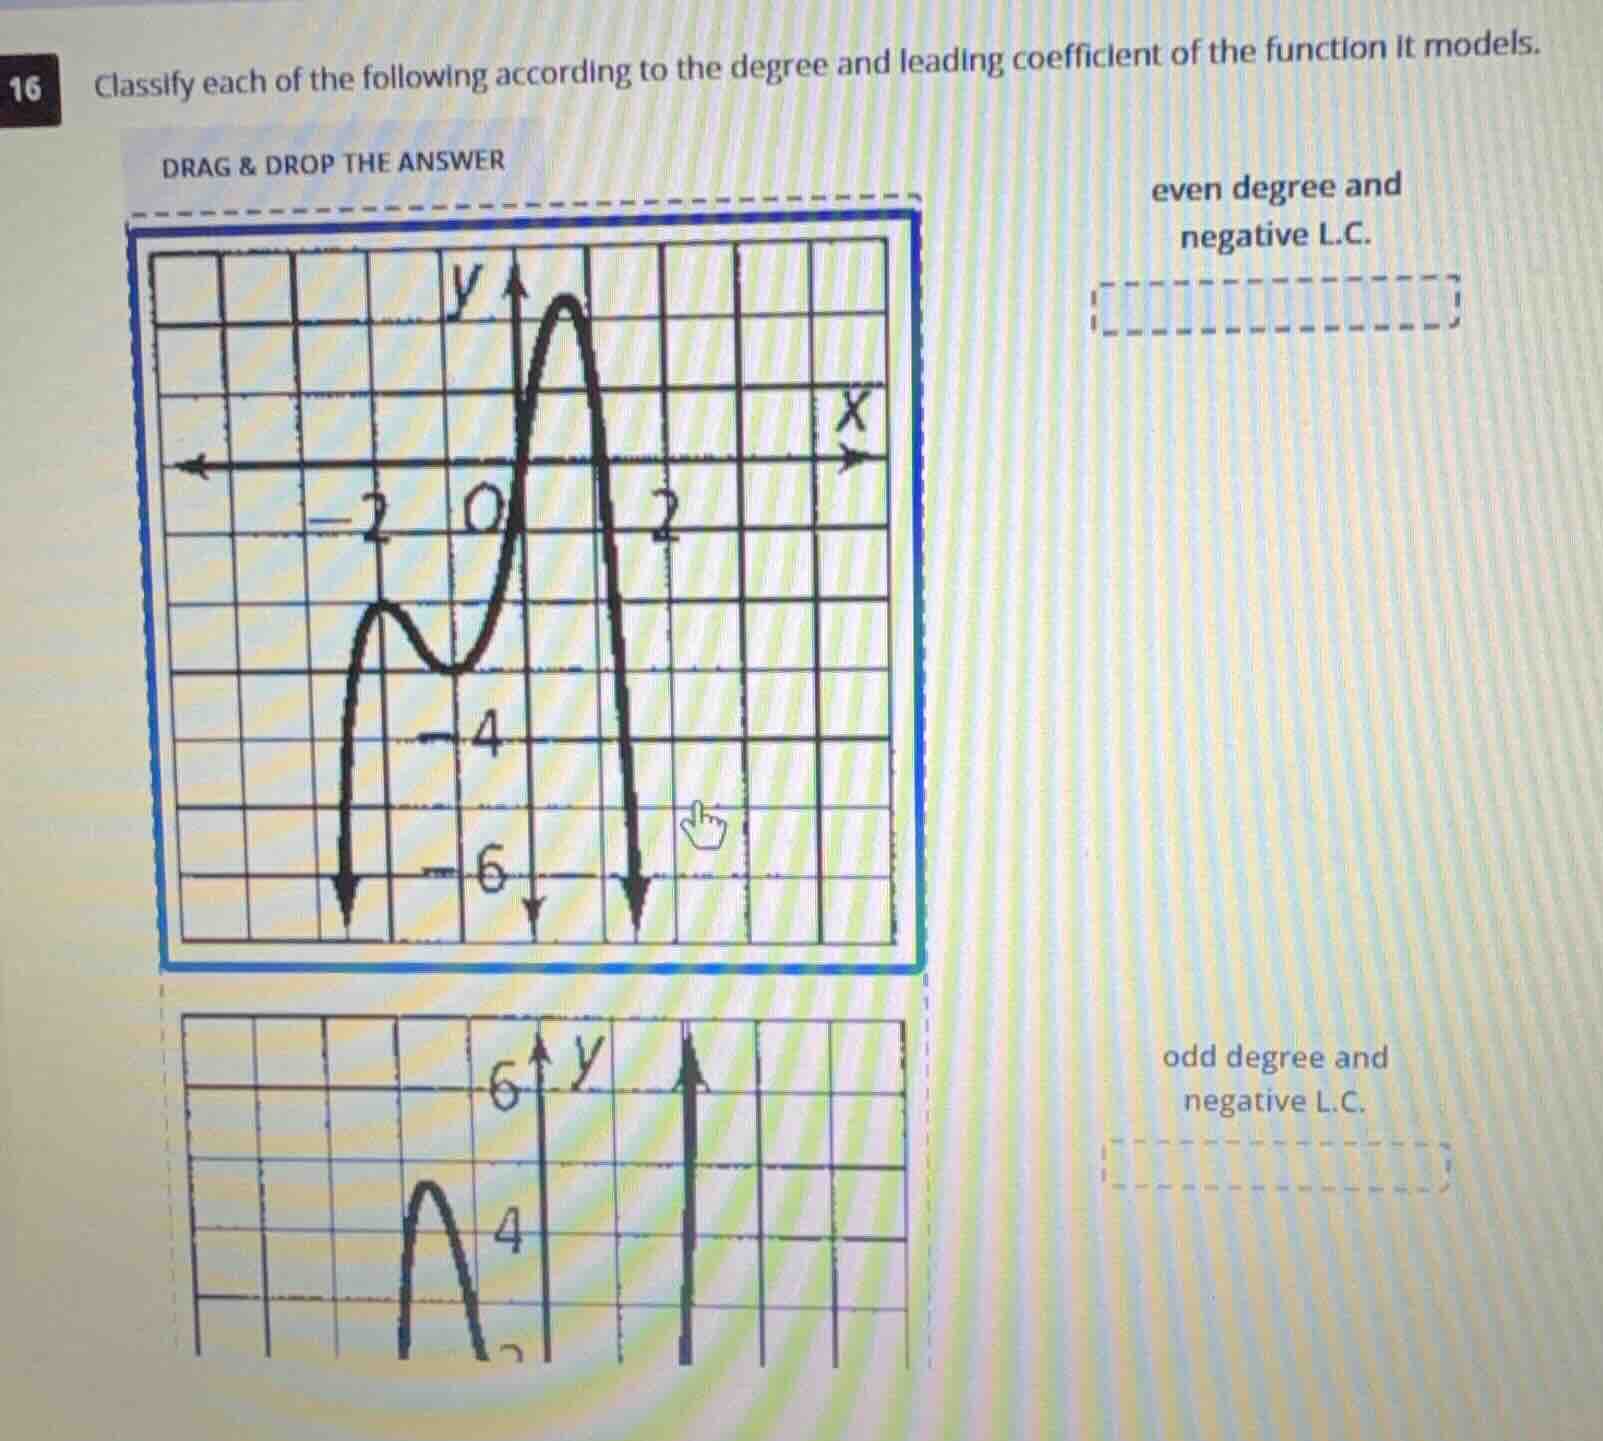
16 classify each of the following according to the degree and leading coefficient of the function it models.
drag & drop the answer
even degree and
negative l.c.
odd degree and
negative l.c.
Step1: Analyze top graph end behavior
The top graph has both ends pointing downward (as $x\to+\infty$, $y\to-\infty$; as $x\to-\infty$, $y\to-\infty$). This matches the end behavior of an even-degree polynomial with a negative leading coefficient.
Step2: Analyze bottom graph end behavior
The bottom graph has one end pointing downward (as $x\to-\infty$, $y\to-\infty$) and one end pointing upward (as $x\to+\infty$, $y\to+\infty$). This matches the end behavior of an odd-degree polynomial with a negative leading coefficient.

Snap & solve any problem in the app
Get step-by-step solutions on Sovi AI
Photo-based solutions with guided steps
Explore more problems and detailed explanations
- Top graph: even degree and negative L.C.
- Bottom graph: odd degree and negative L.C.