QUESTION IMAGE
Question
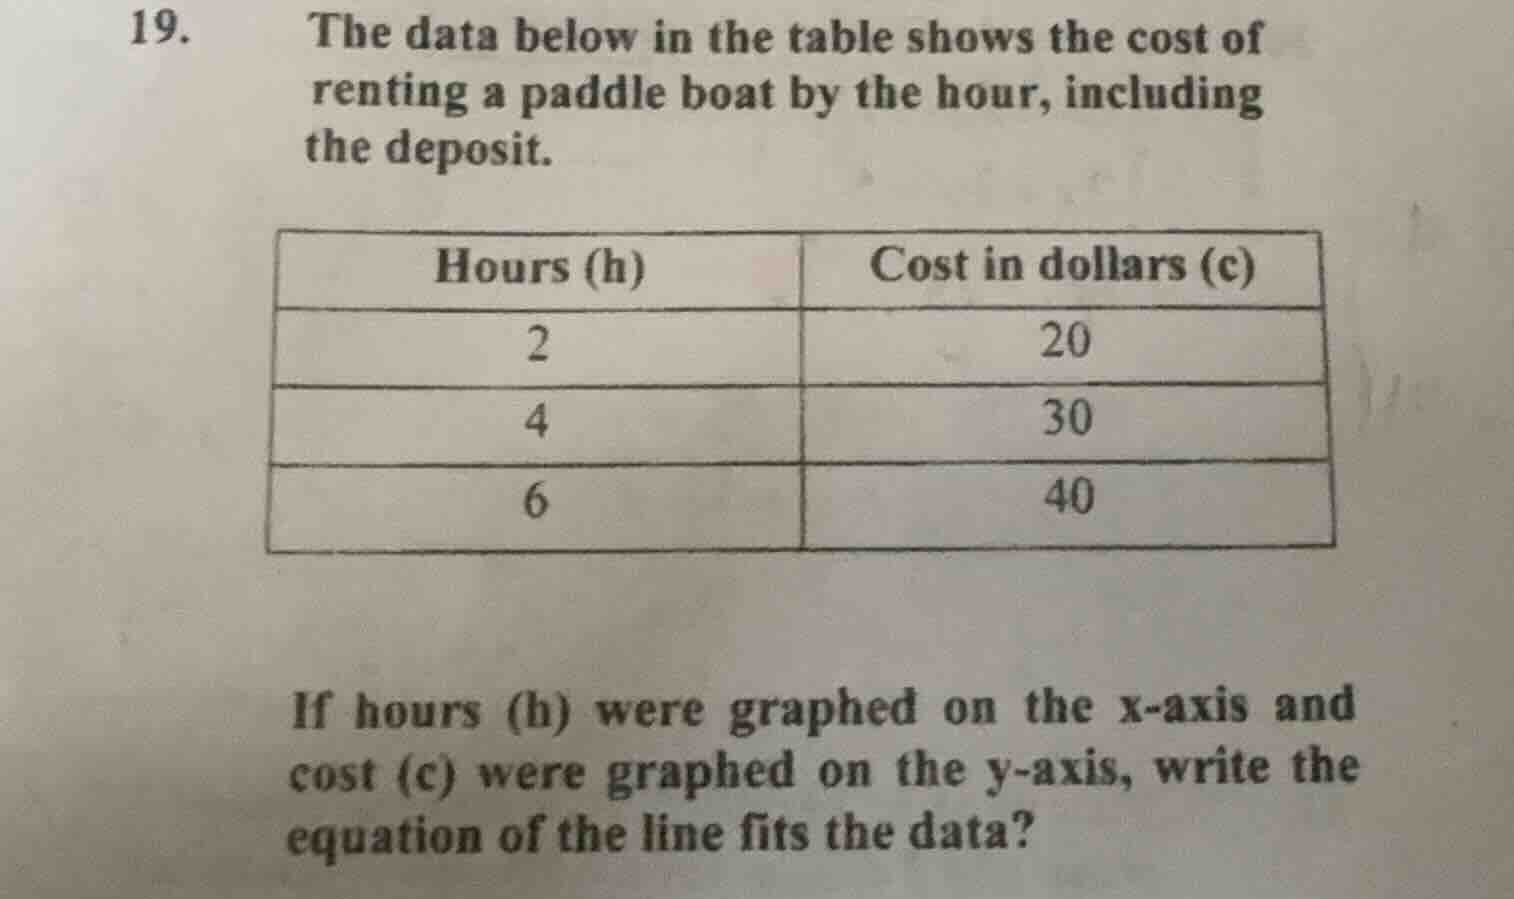
- the data below in the table shows the cost of renting a paddle boat by the hour, including the deposit.
hours (h) | cost in dollars (c)
2 | 20
4 | 30
6 | 40
if hours (h) were graphed on the x - axis and cost (c) were graphed on the y - axis, write the equation of the line fits the data?
Step1: Find the slope (m)
The slope formula is $m = \frac{c_2 - c_1}{h_2 - h_1}$. Using the points (2, 20) and (4, 30):
$m = \frac{30 - 20}{4 - 2} = \frac{10}{2} = 5$
Step2: Find the y-intercept (b)
Use the point-slope form $c - c_1 = m(h - h_1)$ with (2, 20) and $m = 5$:
$c - 20 = 5(h - 2)$
$c - 20 = 5h - 10$
$c = 5h + 10$ (check with (6, 40): $5(6) + 10 = 40$, which matches)

Snap & solve any problem in the app
Get step-by-step solutions on Sovi AI
Photo-based solutions with guided steps
Explore more problems and detailed explanations
$c = 5h + 10$