QUESTION IMAGE
Question
x | y
0 | -3
1 | -6
4 | -12
9 | -18
16 | -27
x | y
0 | 1
1 | -2
4 | -5
9 | -8
16 | -11
x | y
-1 | 0
0 | -3
3 | -12
8 | -27
15 | -48
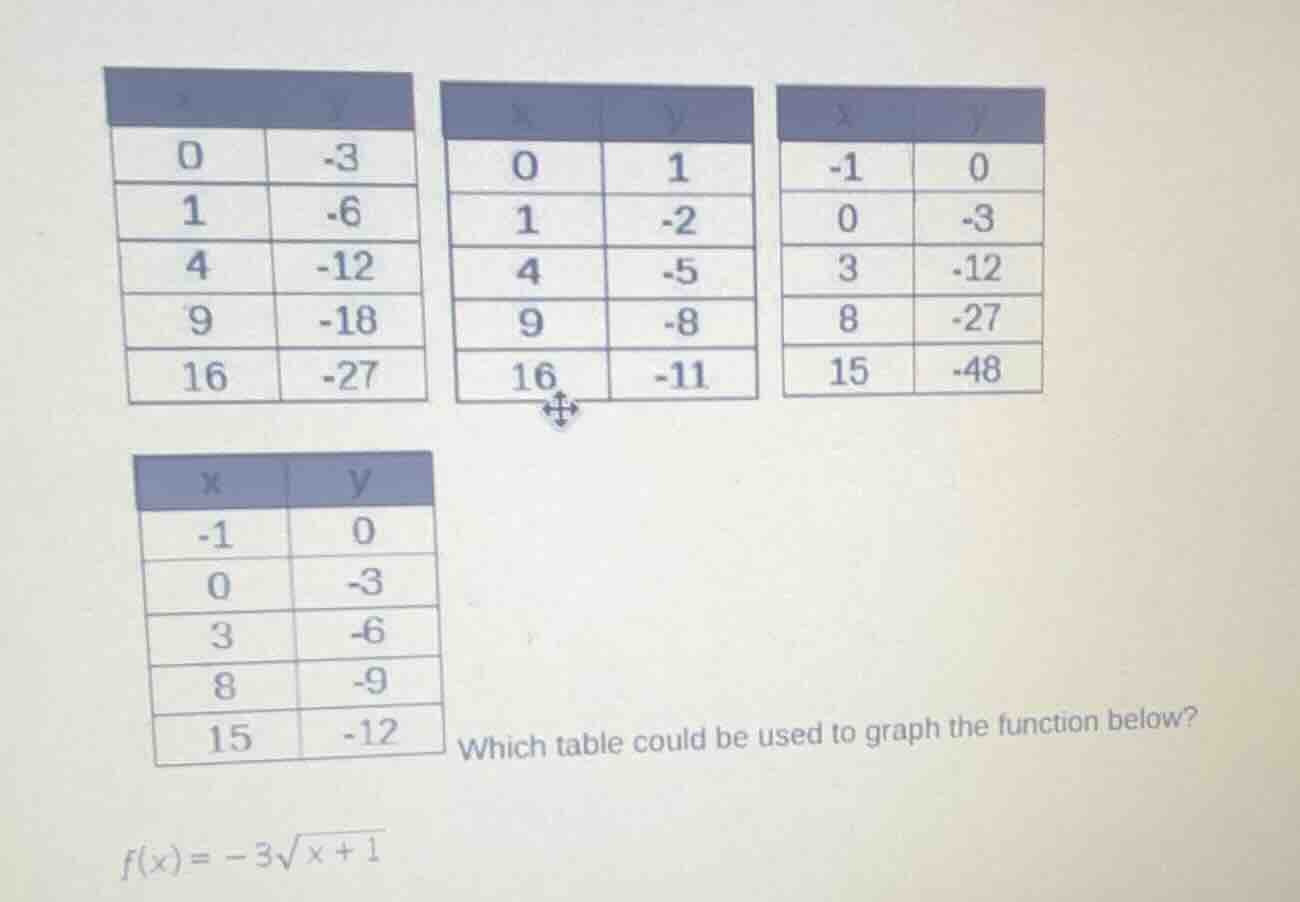
x | y
-1 | 0
0 | -3
3 | -6
8 | -9
15 | -12
which table could be used to graph the function below?
$f(x) = -3\sqrt{x + 1}$
Step1: Substitute x=-1 into function
$f(-1) = -3\sqrt{-1+1} = -3\sqrt{0} = 0$
Step2: Substitute x=0 into function
$f(0) = -3\sqrt{0+1} = -3\sqrt{1} = -3$
Step3: Substitute x=3 into function
$f(3) = -3\sqrt{3+1} = -3\sqrt{4} = -3\times2 = -6$
Step4: Substitute x=8 into function
$f(8) = -3\sqrt{8+1} = -3\sqrt{9} = -3\times3 = -9$
Step5: Substitute x=15 into function
$f(15) = -3\sqrt{15+1} = -3\sqrt{16} = -3\times4 = -12$

Snap & solve any problem in the app
Get step-by-step solutions on Sovi AI
Photo-based solutions with guided steps
Explore more problems and detailed explanations
The table with the following (x,y) pairs:
(-1, 0), (0, -3), (3, -6), (8, -9), (15, -12) (the bottom-left table)