QUESTION IMAGE
Question
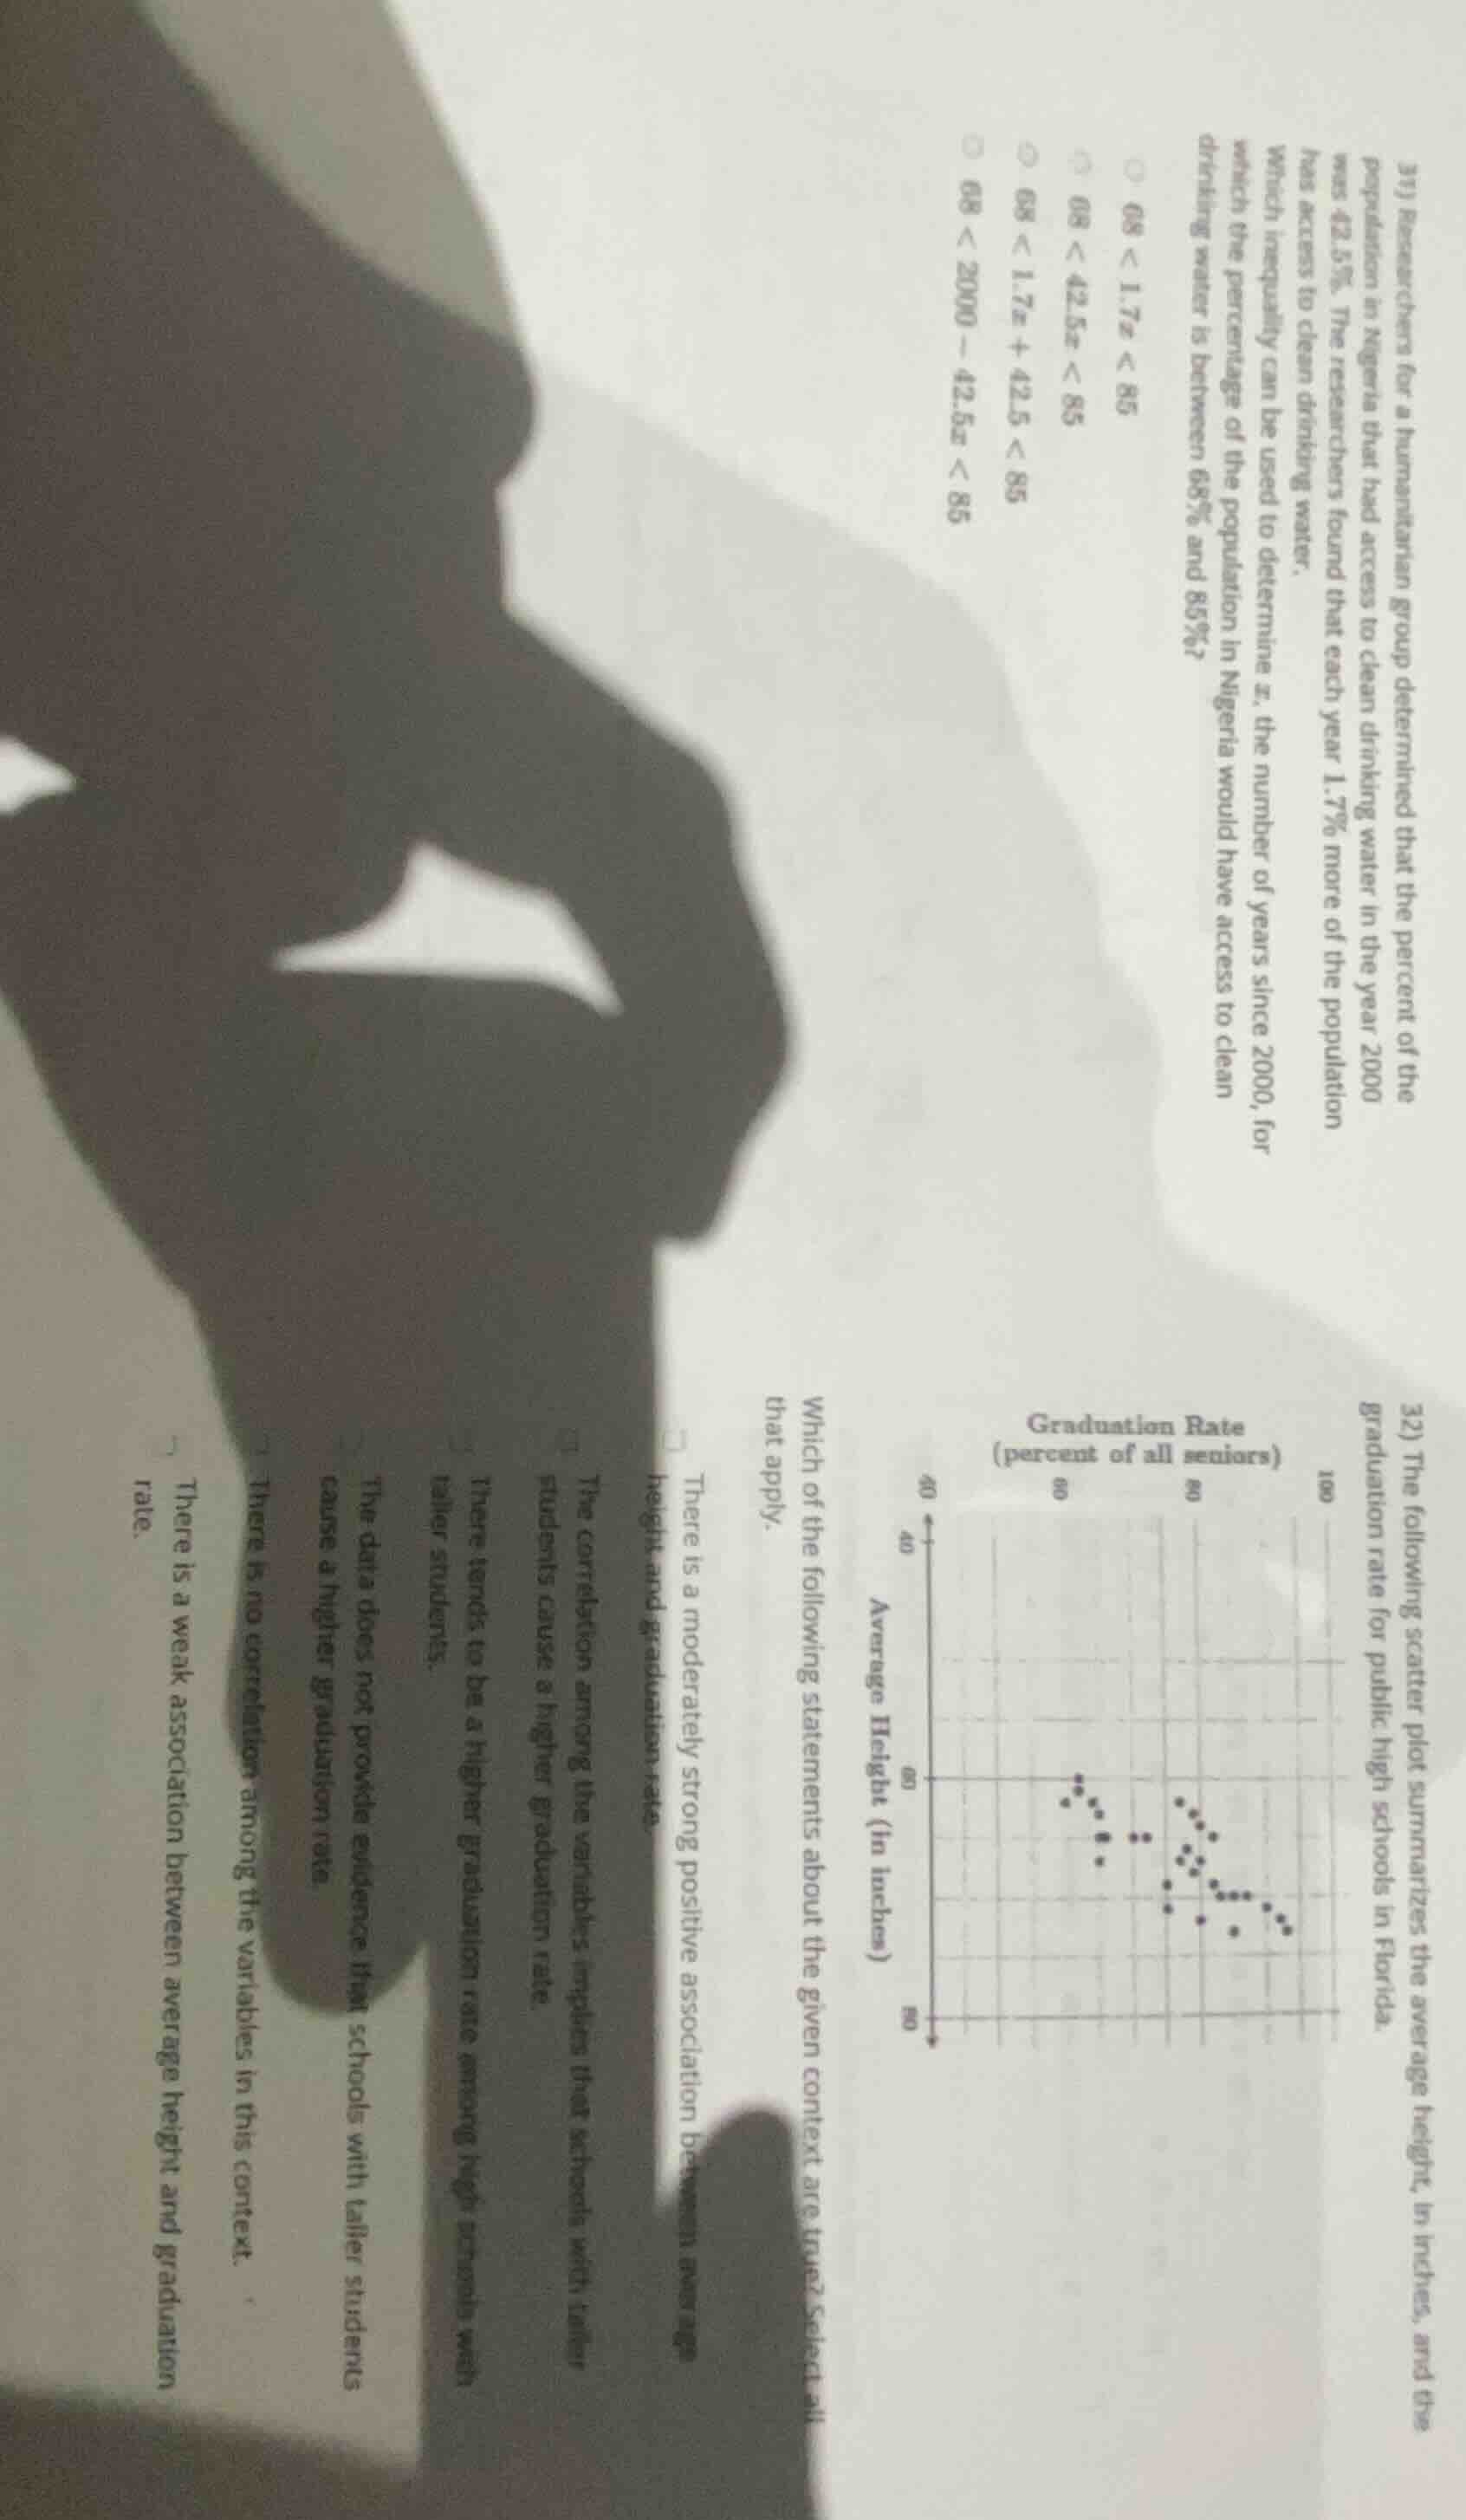
- researchers for a humanitarian group determined that the percent of the population in nigeria that had access to clean drinking water in the year 2000 was 42.5%. the researchers found that each year 1.7% more of the population has access to clean drinking water. which inequality can be used to determine x, the number of years since 2000, for which the percentage of the population in nigeria would have access to clean drinking water is between 68% and 85%?\\(\bigcirc\\) 68 < 1.7x < 85\\(\bigcirc\\) 68 < 42.5x < 85\\(\bigcirc\\) 68 < 1.7x + 42.5 < 85\\(\bigcirc\\) 68 < 2000 - 42.5x < 85\\32) the following scatter plot summarizes the average height, in inches, and the graduation rate for public high schools in florida.\
which of the following statements about the given context are true? select all that apply.\\(\square\\) there is a moderately strong positive association between average height and graduation rate.\\(\square\\) the correlation among the variables implies that schools with taller students cause a higher graduation rate.\\(\square\\) there tends to be a higher graduation rate among high schools with taller students.\\(\square\\) the data does not provide evidence that schools with taller students cause a higher graduation rate.\\(\square\\) there is no correlation among the variables in this context.\\(\square\\) there is a weak association between average height and graduation rate.
Problem 31 (Water Access Inequality)
Step 1: Define the initial and target percentages
In 2000, the access percentage was \( 42.5\% \). Each year, it increases by \( 1.7\% \), so after \( x \) years, the percentage is \( 42.5 + 1.7x \). We want this to be between \( 68\% \) and \( 85\% \), so the inequality is \( 68 < 42.5 + 1.7x < 85 \).
Step 2: Match with the given options
Looking at the options, the inequality \( 68 < 1.7x + 42.5 < 85 \) is the same as our derived inequality (addition is commutative, so \( 42.5 + 1.7x = 1.7x + 42.5 \)).
- "There is a moderately strong positive association between average height and graduation rate.": The scatter plot does not show a clear positive trend; the points seem to have a negative or weak trend, so this is false.
- "The correlation among the variables implies that schools with taller students cause a higher graduation rate.": Correlation does not imply causation, so this is false.
- "There tends to be a higher graduation rate among high schools with taller students.": The scatter plot shows that as height increases, graduation rate tends to decrease (negative trend), so this is false.
- "The data does not provide evidence that schools with taller students cause a higher graduation rate.": Since correlation ≠ causation, and the trend here is negative anyway, this is true.
- "There is no correlation among the variables in this context.": There is a weak negative correlation, so "no correlation" is not accurate, but among the options, this is less wrong? Wait, re - evaluating: The points are somewhat scattered but have a slight negative trend. However, the option "There is a weak association between average height and graduation rate" is better. Wait, the options given: Let's re - check the options. The options are:
- There is a moderately strong positive association between average height and graduation rate. (False)
- The correlation among the variables implies that schools with taller students cause a higher graduation rate. (False, causation)
- There tends to be a higher graduation rate among high schools with taller students. (False, negative trend)
- The data does not provide evidence that schools with taller students cause a higher graduation rate. (True, because correlation doesn't imply causation, and also the trend is negative)
- There is no correlation among the variables in this context. (False, weak negative correlation)
- There is a weak association between average height and graduation rate. (This is also true, but among the given options, "The data does not provide evidence that schools with taller students cause a higher graduation rate" is a key point about causation, which is always true regardless of correlation direction, and "There is a weak association between average height and graduation rate" is also true. But let's go with the most appropriate. The scatter plot has a weak negative association, so "There is a weak association between average height and graduation rate" and "The data does not provide evidence that schools with taller students cause a higher graduation rate" are true. But based on the options, let's pick the correct ones:

Snap & solve any problem in the app
Get step-by-step solutions on Sovi AI
Photo-based solutions with guided steps
Explore more problems and detailed explanations
\( 68 < 1.7x + 42.5 < 85 \) (the corresponding option)