QUESTION IMAGE
Question
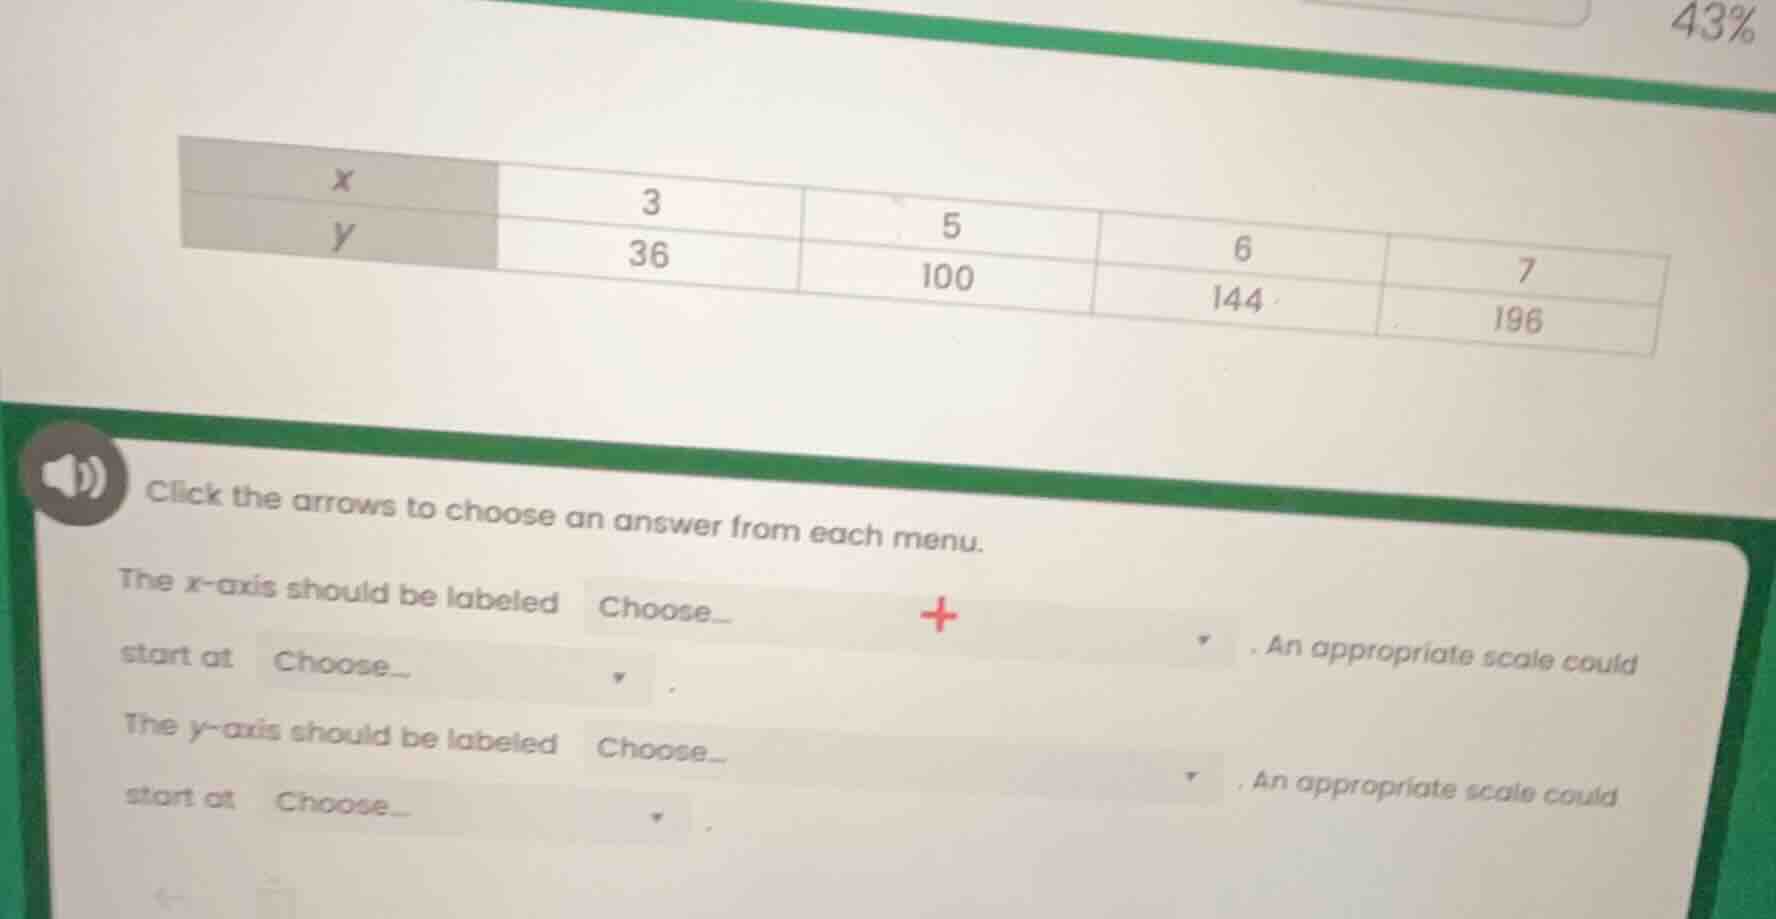
x | 3 | 5 | 6 | 7
y | 36 | 100 | 144 | 196
click the arrows to choose an answer from each menu.
the x - axis should be labeled choose... an appropriate scale could start at choose...
the y - axis should be labeled choose... an appropriate scale could start at choose...
Step1: Identify x-axis label
The table's first row is the independent variable, so the x-axis is labeled "x".
Step2: Set x-axis start value
The smallest x-value is 3, so start at 3.
Step3: Identify y-axis label
The table's second row is the dependent variable, so the y-axis is labeled "y".
Step4: Set y-axis start value
The smallest y-value is 36, so start at 36.
Step5: Determine x-axis scale
The x-values increase by 1-2, so scale: 1 unit per tick.
Step6: Determine y-axis scale
The y-values are multiples of squares, scale: 20 units per tick.

Snap & solve any problem in the app
Get step-by-step solutions on Sovi AI
Photo-based solutions with guided steps
Explore more problems and detailed explanations
The x-axis should be labeled x, start at 3, An appropriate scale could be 1 unit per tick mark
The y-axis should be labeled y, start at 36, An appropriate scale could be 20 units per tick mark