QUESTION IMAGE
Question
4x
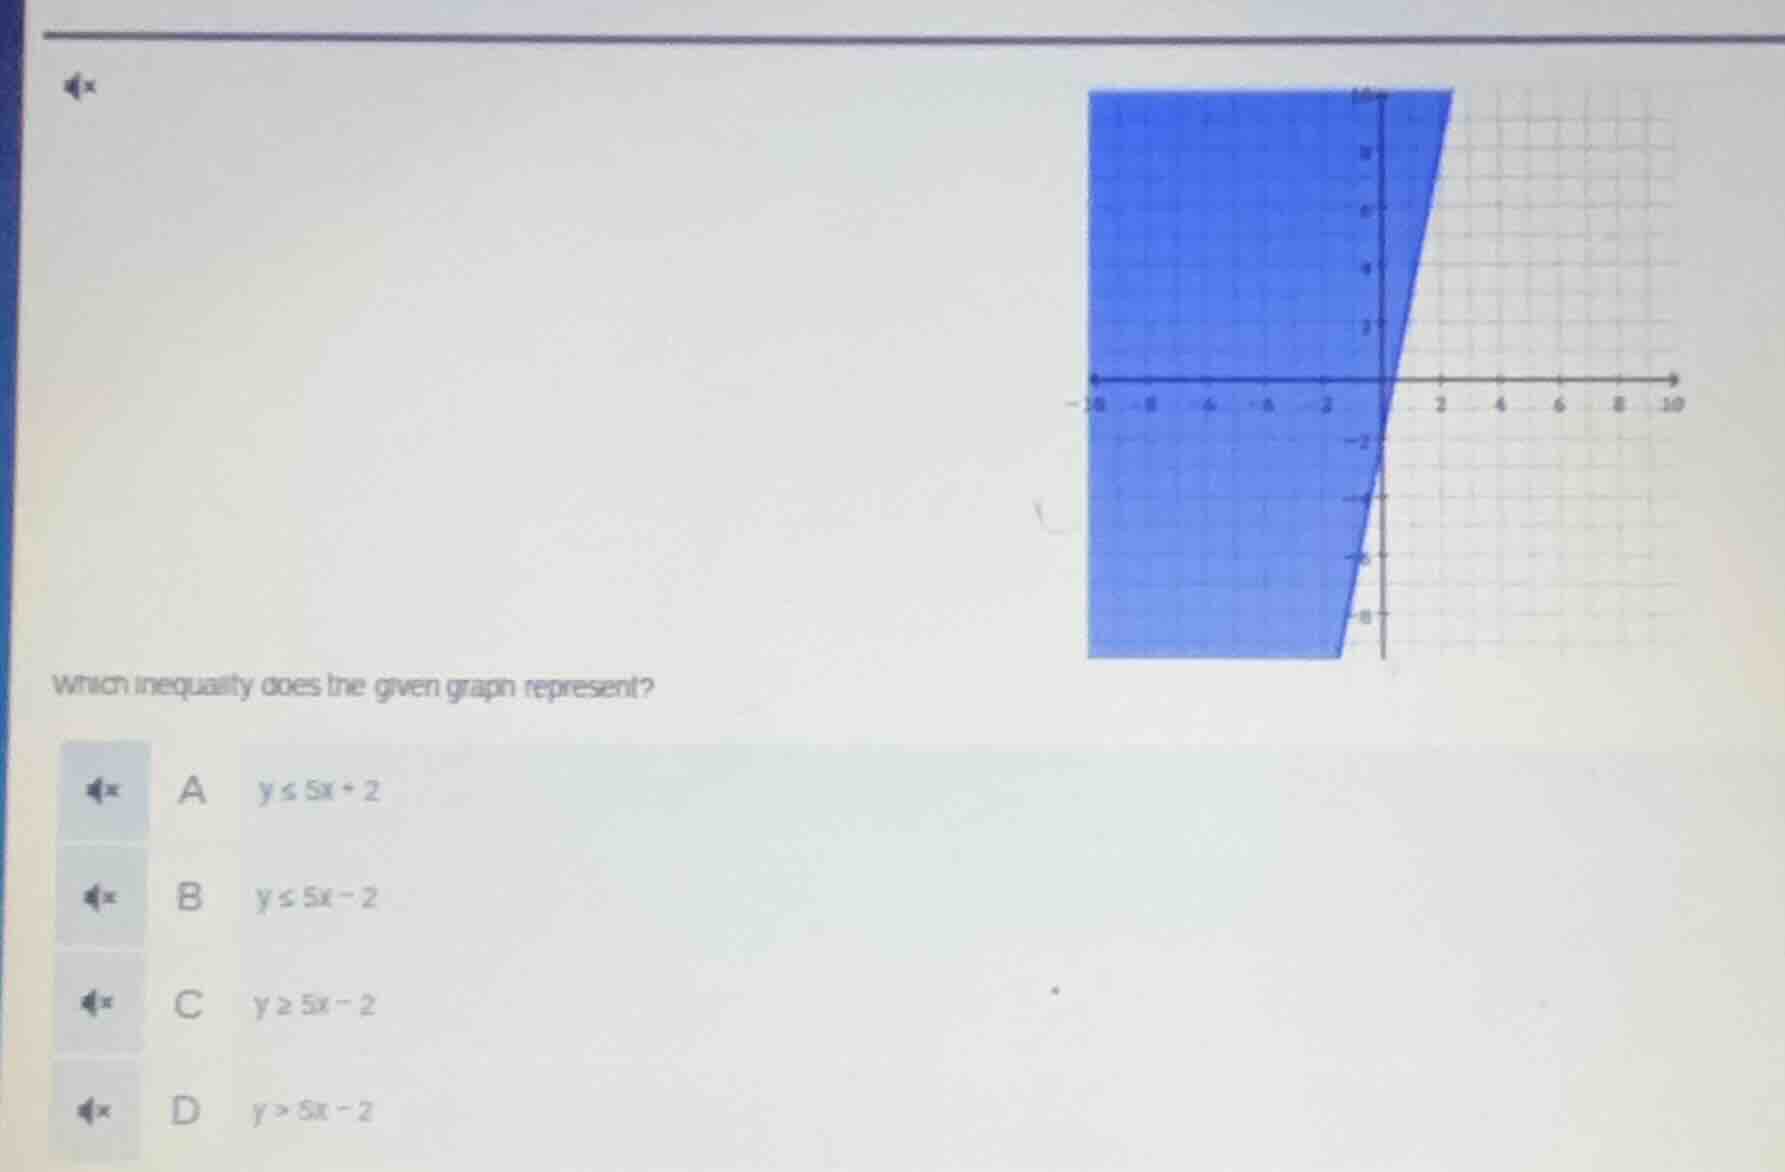
which inequality does the given graph represent?
a ( y leq 5x + 2 )
b ( y leq 5x - 2 )
c ( y geq 5x - 2 )
d ( y > 5x - 2 )
Step1: Identify the line equation
The graph has a line with slope \( m = 5 \) (since for \( x = 0 \), \( y=-2 \), and for \( x = 1 \), \( y = 5(1)-2=3 \), so slope \( \frac{3 - (-2)}{1 - 0}=5 \)) and y - intercept \( b=-2 \). So the line equation is \( y = 5x - 2 \).
Step2: Determine the inequality type (line style)
The line in the graph is solid (since the boundary is included), so the inequality will have \( \leq \) or \( \geq \), eliminating option D (\( y>5x - 2 \)) which has a dashed line.
Step3: Determine the shaded region
The shaded region is above the line (check a test point, e.g., \( (0,0) \): plug into \( y \) and \( 5x - 2 \): \( 0 \) vs \( 5(0)-2=-2 \). Since \( 0\geq - 2 \), the region where \( y\geq5x - 2 \) is shaded (as the line is solid, and the test point satisfies \( y\geq5x - 2 \)). Option A has \( y\leq5x + 2 \) (wrong y - intercept), option B has \( y\leq5x - 2 \) (shaded below), so option C is correct.

Snap & solve any problem in the app
Get step-by-step solutions on Sovi AI
Photo-based solutions with guided steps
Explore more problems and detailed explanations
C. \( y \geq 5x - 2 \)