QUESTION IMAGE
Question
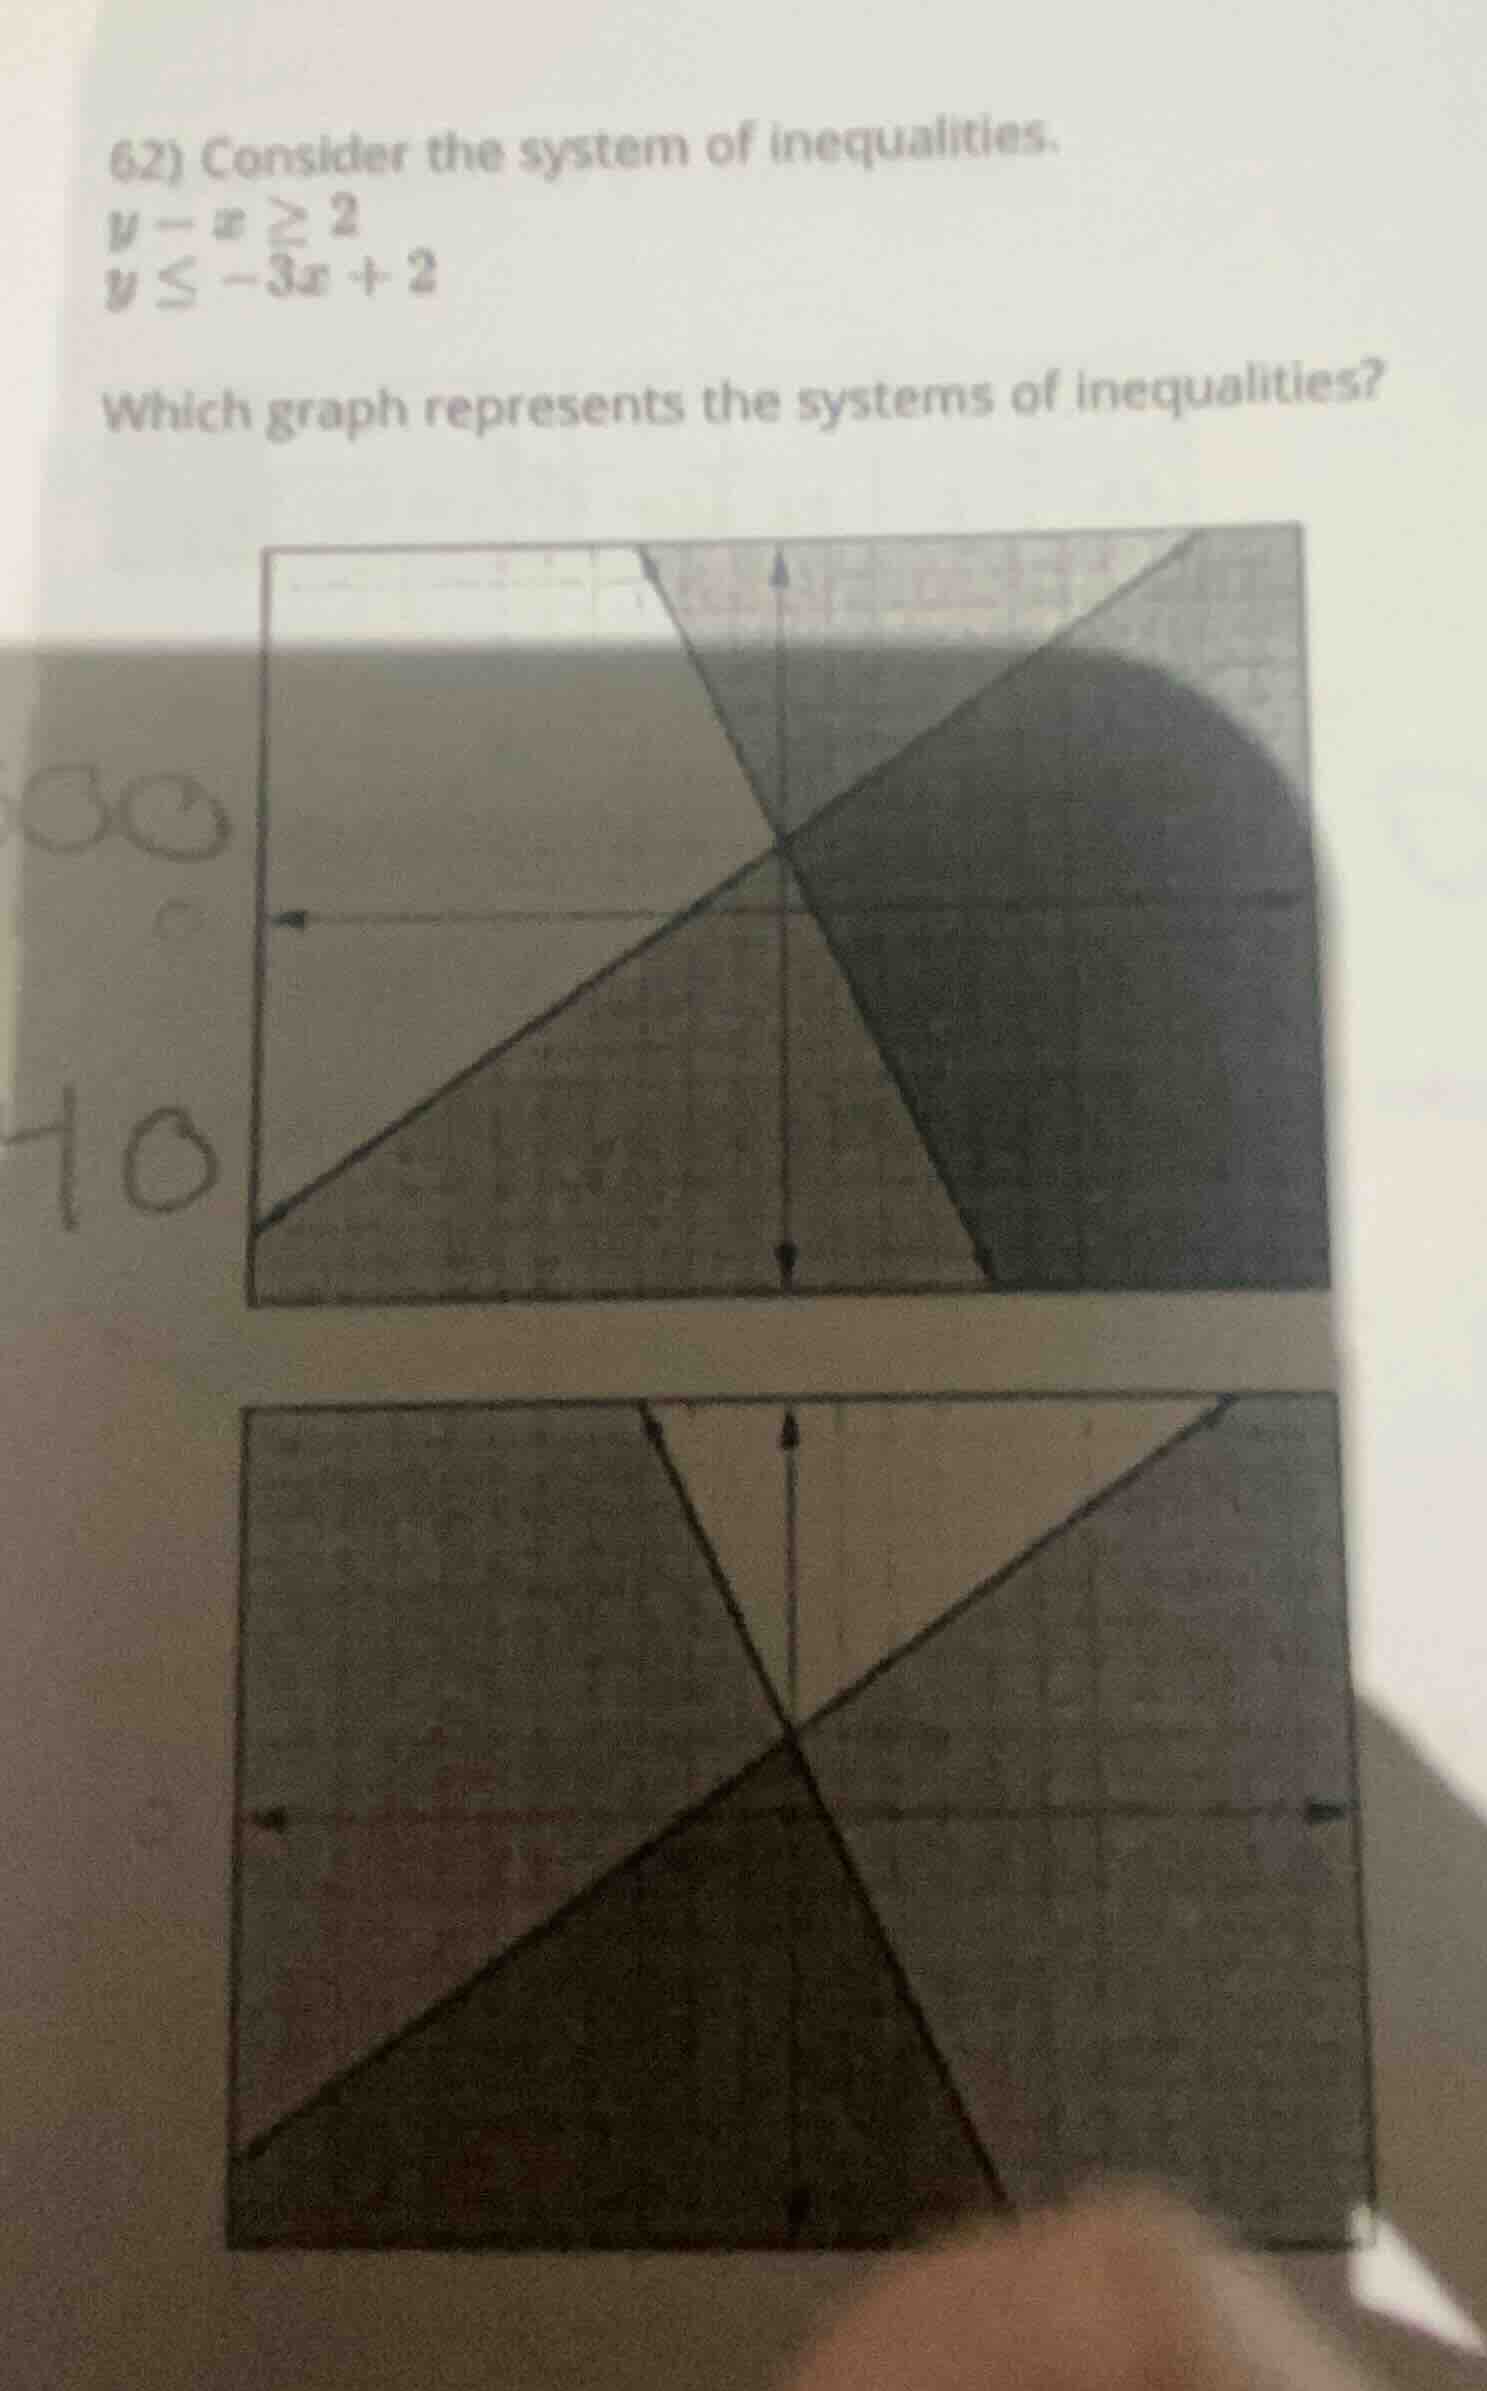
- consider the system of inequalities.
y - x ≥ 2
y ≤ -3x + 2
which graph represents the systems of inequalities?
Step1: Analyze the first inequality \( y - x \geq 2 \)
Rewrite it in slope - intercept form (\(y=mx + b\)): \(y\geq x + 2\). The slope \(m = 1\) and the y - intercept \(b = 2\). Since the inequality is \(y\geq x + 2\), the line \(y=x + 2\) should be solid (because of the "greater than or equal to" sign), and we shade the region above the line.
Step2: Analyze the second inequality \(y\leq- 3x + 2\)
The slope of the line \(y=-3x + 2\) is \(m=-3\) and the y - intercept \(b = 2\). Since the inequality is \(y\leq-3x + 2\), the line \(y = - 3x+2\) should be solid (because of the "less than or equal to" sign), and we shade the region below the line.
Step3: Find the intersection of the two regions
We need to find the region that is above the line \(y=x + 2\) and below the line \(y=-3x + 2\) simultaneously.
First, find the intersection point of the two lines \(y=x + 2\) and \(y=-3x + 2\). Set \(x + 2=-3x + 2\).
Subtract 2 from both sides: \(x=-3x\).
Add \(3x\) to both sides: \(4x = 0\), so \(x = 0\). Substitute \(x = 0\) into \(y=x + 2\), we get \(y=2\). So the intersection point is \((0,2)\).
The line \(y=x + 2\) has a positive slope (going up from left to right) and \(y=-3x + 2\) has a negative slope (going down from left to right). The region that satisfies both inequalities is the area that is above \(y=x + 2\) and below \(y=-3x + 2\).
To determine the correct graph, we can also test a point. Let's test the point \((0,3)\) in the first inequality: \(3-0=3\geq2\) (true). In the second inequality: \(3\leq-3(0)+2=2\) (false). Test the point \((0,1)\): In the first inequality, \(1 - 0=1\geq2\) (false). Test the point \((-1,2)\): In the first inequality, \(2-(-1)=3\geq2\) (true). In the second inequality, \(2\leq-3(-1)+2=3 + 2=5\) (true). So the point \((-1,2)\) is in the solution region.
Now, looking at the two graphs (assuming the first graph has the region above \(y = x+2\) and below \(y=-3x + 2\) and the second graph does not), the correct graph should have the overlapping region of the two shaded areas (above \(y=x + 2\) and below \(y=-3x + 2\)).

Snap & solve any problem in the app
Get step-by-step solutions on Sovi AI
Photo-based solutions with guided steps
Explore more problems and detailed explanations
The graph (the first one, assuming the first graph shows the region above \(y = x + 2\) and below \(y=-3x + 2\)) that represents the system of inequalities is the one where the shaded region is above the line \(y=x + 2\) (with slope 1, y - intercept 2) and below the line \(y=-3x + 2\) (with slope - 3, y - intercept 2) and the two lines intersect at \((0,2)\). (Since the actual graph options are not fully labeled, but based on the analysis, the correct graph is the one with the overlapping region of the two shaded parts as per the inequality conditions)