QUESTION IMAGE
Question
720448.5819272 cx3nq7
jump to level 1
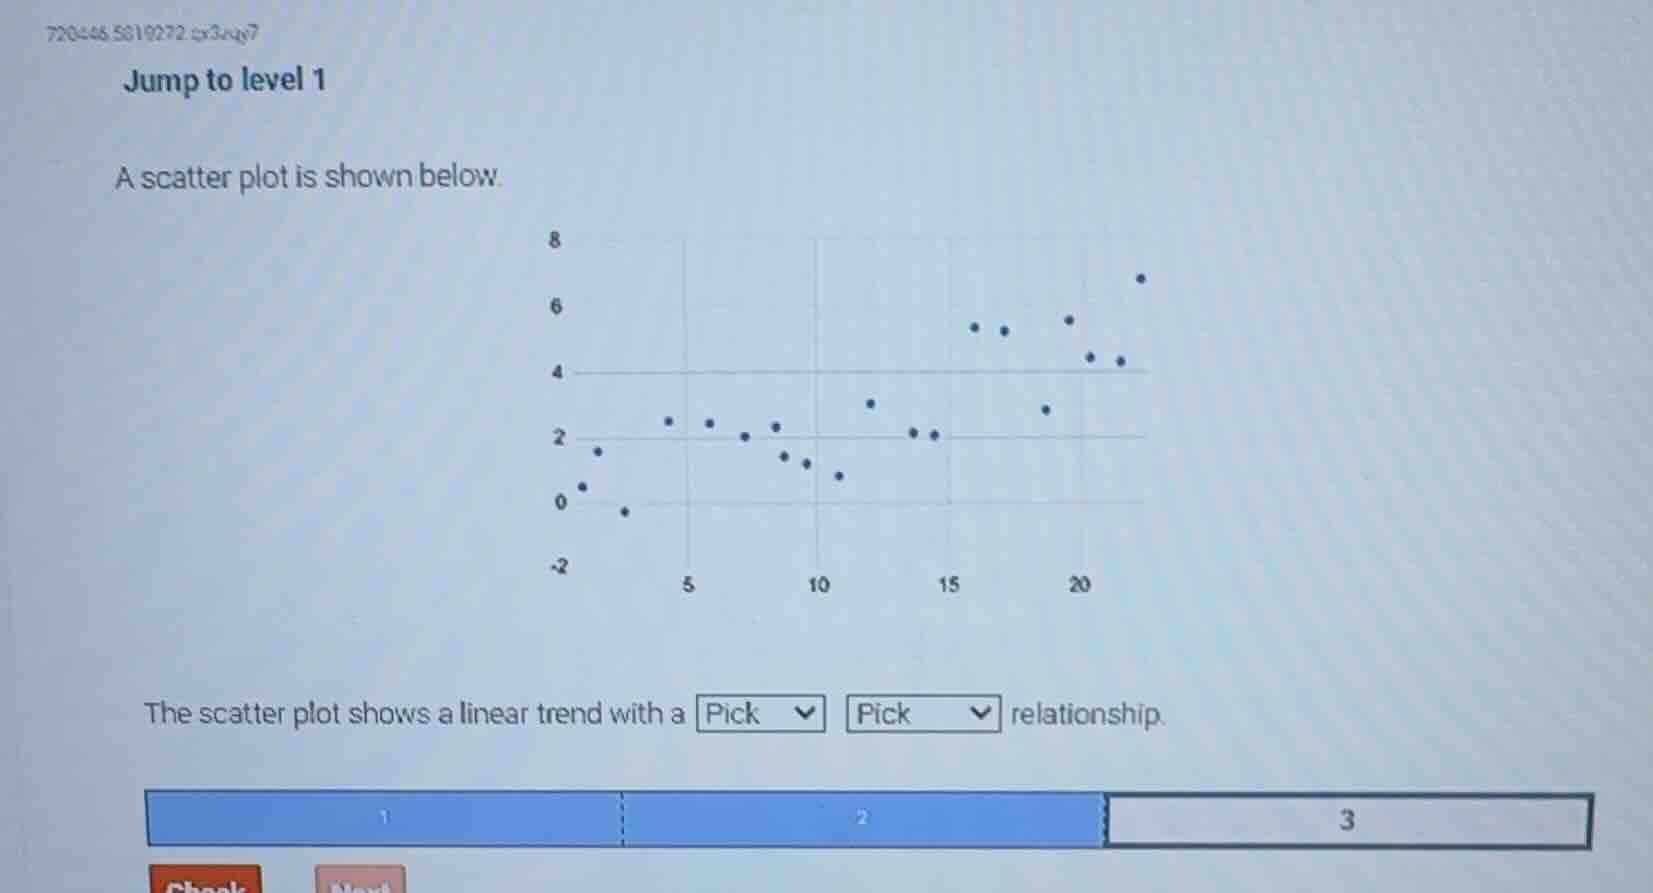
a scatter plot is shown below.
the scatter plot shows a linear trend with a pick pick relationship.
Brief Explanations
Looking at the scatter plot, as the x-values increase, the overall pattern of y-values moves upward, which indicates a positive linear trend. Additionally, the points are clustered relatively closely around the implied trend line, showing a strong relationship.

Snap & solve any problem in the app
Get step-by-step solutions on Sovi AI
Photo-based solutions with guided steps
Explore more problems and detailed explanations
strong, positive