QUESTION IMAGE
Question
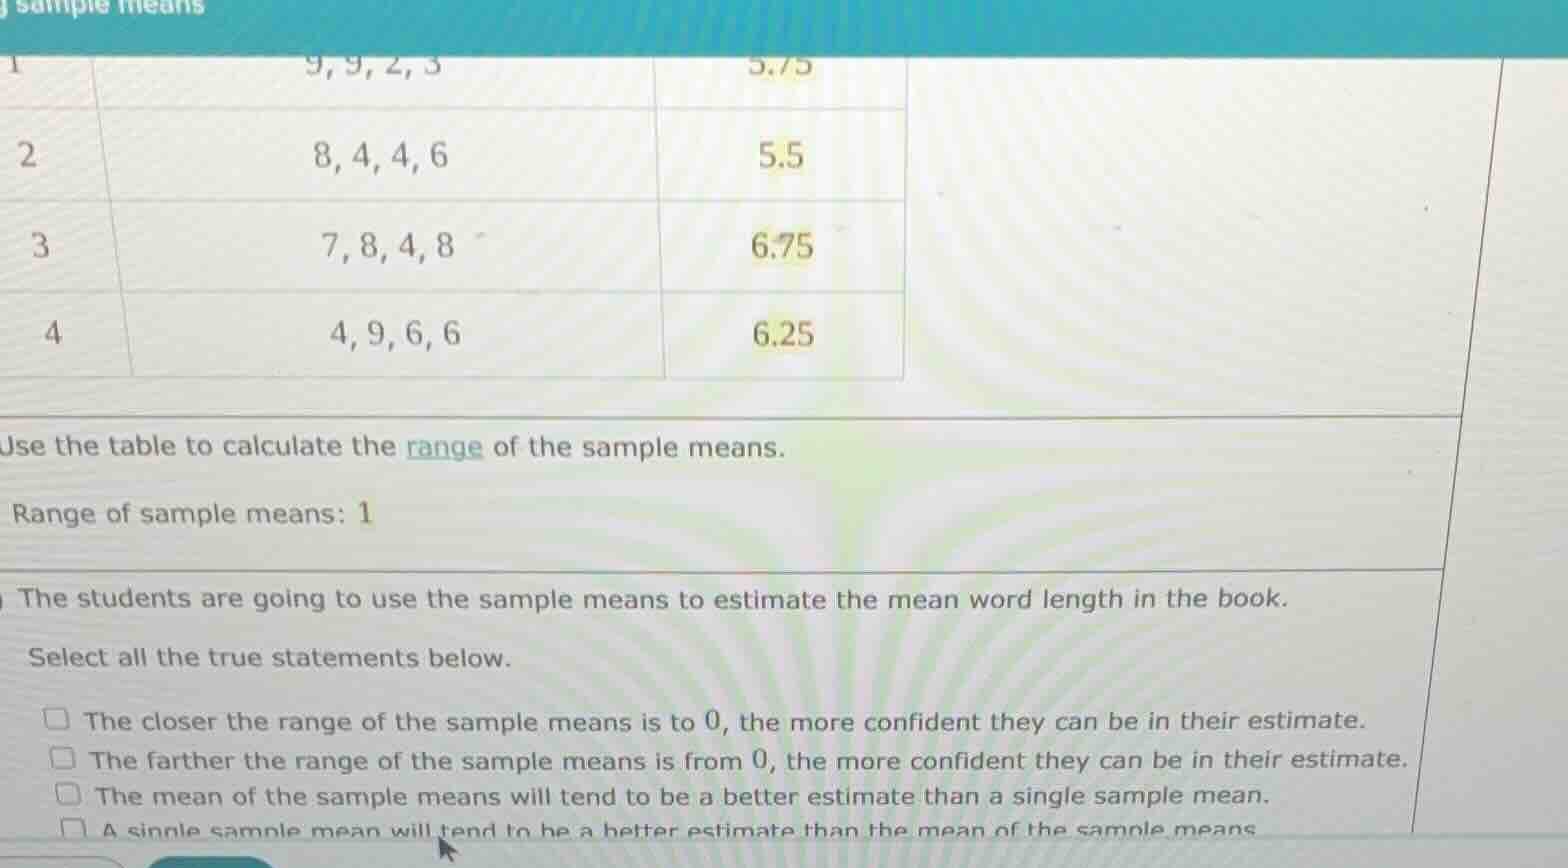
1 9,9,2,3 5.75
2 8,4,4,6 5.5
3 7,8,4,8 6.75
4 4,9,6,6 6.25
use the table to calculate the range of the sample means.
range of sample means: 1
the students are going to use the sample means to estimate the mean word length in the book.
select all the true statements below.
□ the closer the range of the sample means is to 0, the more confident they can be in their estimate.
□ the farther the range of the sample means is from 0, the more confident they can be in their estimate.
□ the mean of the sample means will tend to be a better estimate than a single sample mean.
□ a single sample mean will tend to be a better estimate than the mean of the sample means
Part 1: Calculate the range of the sample means
Step 1: Identify the sample means
The sample means from the table are \( 5.75 \), \( 5.5 \), \( 6.75 \), and \( 6.25 \).
Step 2: Find the maximum and minimum values
First, find the maximum value among the sample means. The values are \( 5.75 \), \( 5.5 \), \( 6.75 \), \( 6.25 \). The maximum value is \( 6.75 \).
Next, find the minimum value. The minimum value among these is \( 5.5 \).
Step 3: Calculate the range
The range is calculated as \( \text{Range} = \text{Maximum value} - \text{Minimum value} \).
Substitute the values: \( 6.75 - 5.5 = 1.25 \). Wait, but the initial text had "Range of sample means: 1" which might be a typo. Let's recalculate:
Wait, the sample means are: for row 1: 5.75, row 2: 5.5, row 3: 6.75, row 4: 6.25.
So maximum is 6.75, minimum is 5.5. Then range is \( 6.75 - 5.5 = 1.25 \). But maybe the original table had a different first value? Wait, the first row's sample mean: the data is 9,9,2,3. Let's recalculate that mean: \( \frac{9 + 9 + 2 + 3}{4} = \frac{23}{4} = 5.75 \), correct. Second row: 8,4,4,6: \( \frac{8 + 4 + 4 + 6}{4} = \frac{22}{4} = 5.5 \), correct. Third row: 7,8,4,8: \( \frac{7 + 8 + 4 + 8}{4} = \frac{27}{4} = 6.75 \), correct. Fourth row: 4,9,6,6: \( \frac{4 + 9 + 6 + 6}{4} = \frac{25}{4} = 6.25 \), correct. So the sample means are 5.75, 5.5, 6.75, 6.25. So maximum is 6.75, minimum is 5.5. Range is \( 6.75 - 5.5 = 1.25 \). But maybe the first row's mean was miscalculated? Wait, 9+9+2+3=23, 23/4=5.75, correct. So range is 1.25. But the initial text had "Range of sample means: 1" which is incorrect. Let's proceed with correct calculation.
- "The closer the range of the sample means is to 0, the more confident they can be in their estimate."
A smaller range (closer to 0) means the sample means are more consistent, so the estimate is more reliable. This is true.
- "The farther the range of the sample means is from 0, the more confident they can be in their estimate."
A larger range means more variability in sample means, so less confidence. This is false.
- "The mean of the sample means will tend to be a better estimate than a single sample mean."
The mean of multiple sample means (sampling distribution mean) is a more accurate estimate of the population mean than a single sample mean, due to the law of large numbers. This is true.
- "A single sample mean will tend to be a better estimate than the mean of the sample means."
This is false, as the mean of sample means (from multiple samples) is more stable and accurate than a single sample mean.

Snap & solve any problem in the app
Get step-by-step solutions on Sovi AI
Photo-based solutions with guided steps
Explore more problems and detailed explanations
The range of the sample means is \( \boldsymbol{1.25} \).