QUESTION IMAGE
Question
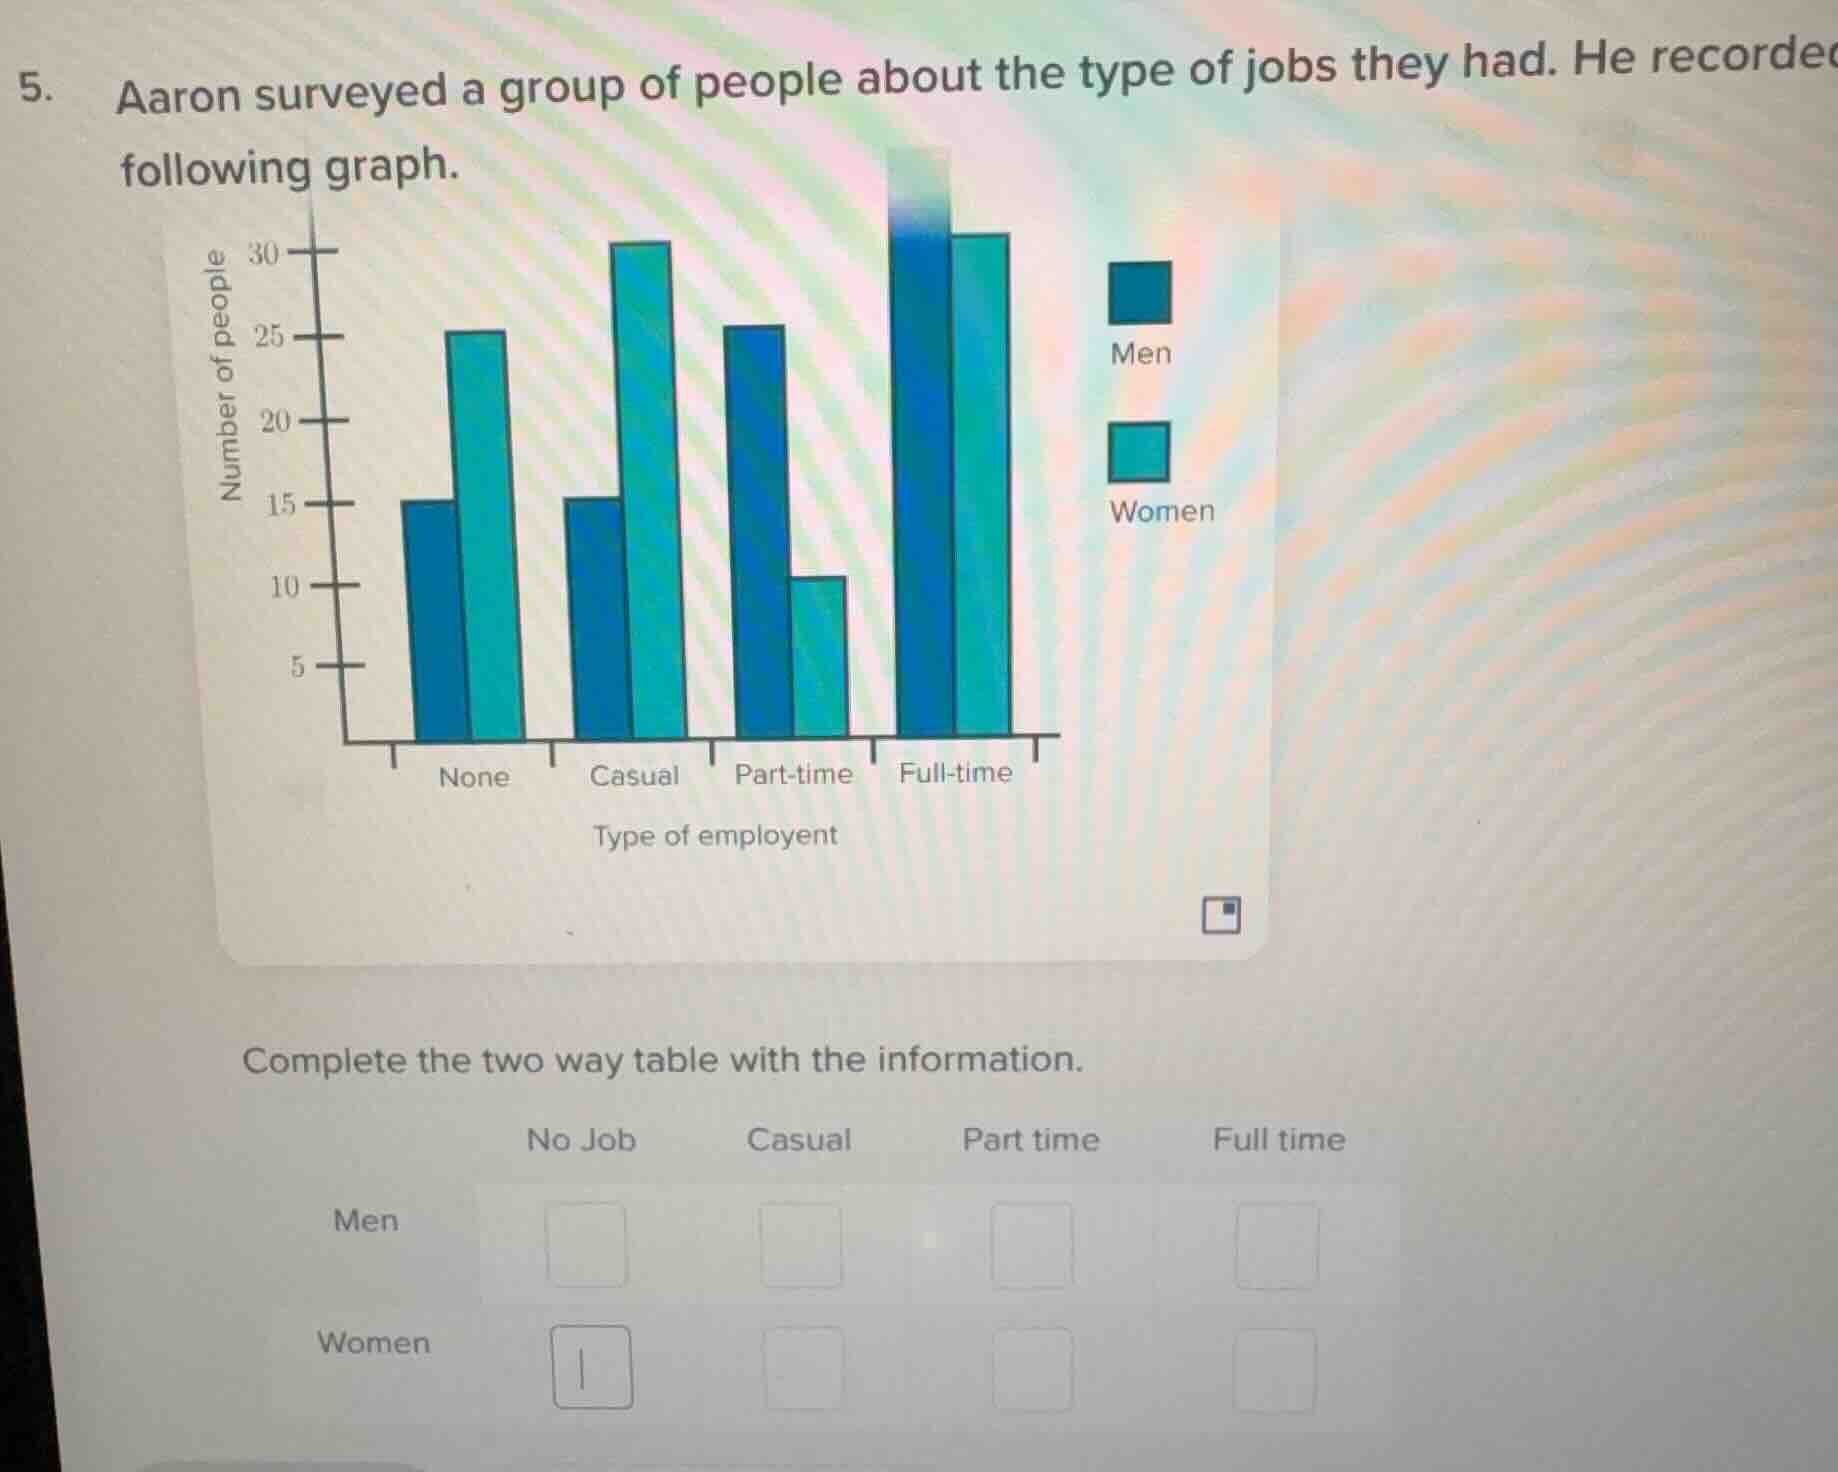
- aaron surveyed a group of people about the type of jobs they had. he recorded the following graph.
complete the two way table with the information.
no job casual part time full time
men
women
Step1: Analyze "No Job" category
From the bar graph, for "No Job", Men's bar reaches 15, Women's bar reaches 25. So Men (No Job): 15; Women (No Job): 25.
Step2: Analyze "Casual" category
For "Casual", Men's bar is 15, Women's bar is 30. So Men (Casual): 15; Women (Casual): 30.
Step3: Analyze "Part - time" category
For "Part - time", Men's bar is 25, Women's bar is 10. So Men (Part - time): 25; Women (Part - time): 10.
Step4: Analyze "Full - time" category
For "Full - time", Men's bar is 30, Women's bar is 30. So Men (Full - time): 30; Women (Full - time): 30.

Snap & solve any problem in the app
Get step-by-step solutions on Sovi AI
Photo-based solutions with guided steps
Explore more problems and detailed explanations
| No Job | Casual | Part time | Full time | |
|---|---|---|---|---|
| Women | 25 | 30 | 10 | 30 |