QUESTION IMAGE
Question
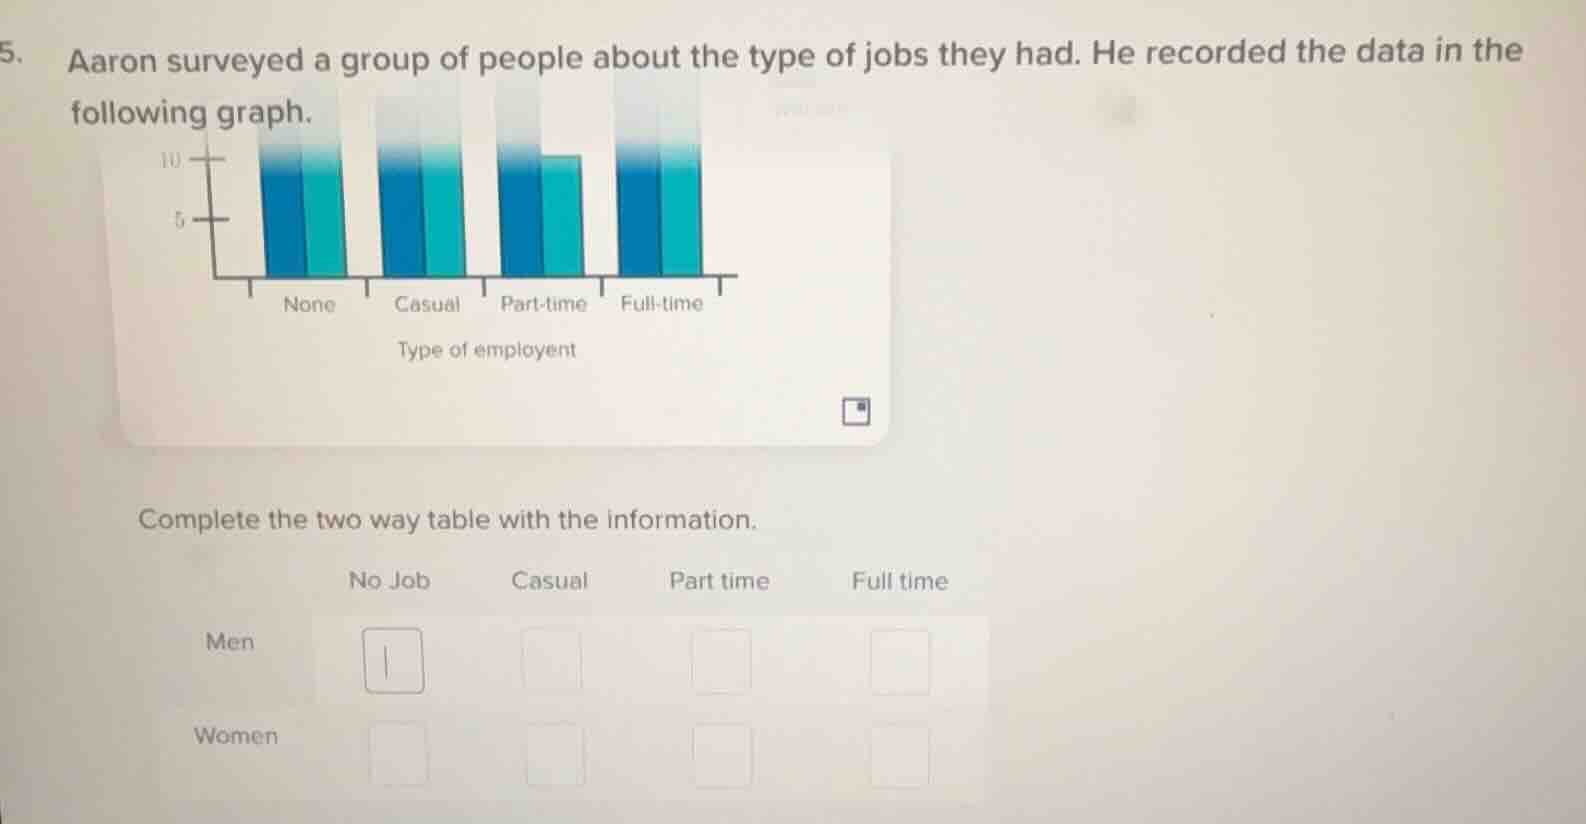
- aaron surveyed a group of people about the type of jobs they had. he recorded the data in the following graph. complete the two way table with the information. no job casual part time full time men women
Step1: Analyze the bar graph for "No Job" (Men)
Assume the blue bars represent men. From the graph, the blue bar for "None" (No Job) reaches up to 10? Wait, no, the y - axis has marks at 5 and 10. Wait, maybe the blue (men) and cyan (women) for each category. Let's assume the height of the blue bar (men) for "No Job" is 10? Wait, no, maybe the graph has for "None" (No Job): men (blue) and women (cyan) both at 10? Wait, the original graph: "None" has blue and cyan bars, "Casual" same, "Part - time" blue is 10, cyan is 10? Wait, no, "Part - time" has a shorter cyan bar (women) at 10? Wait, maybe the y - axis is from 0 to 10, with 5 and 10 marked. Let's re - examine:
For "No Job" (Men - blue): Let's say the height is 10 (since it's up to the 10 mark). Wait, but the user's table has "Men" and "No Job" with a box. Wait, maybe the graph is a stacked or grouped bar? Wait, the problem says "He recorded the data in the following graph" with categories None, Casual, Part - time, Full - time, and two colors (men and women). Let's assume:
- No Job: Men (blue) = 10, Women (cyan) = 10 (since both bars are same height up to 10)
- Casual: Men (blue) = 10, Women (cyan) = 10 (same height)
- Part - time: Men (blue) = 10, Women (cyan) = 10? No, the Part - time cyan bar is shorter? Wait, the Part - time has a cyan bar (women) at 10? Wait, no, the Part - time bar for women is shorter, maybe 10? Wait, no, the graph shows for Part - time: blue (men) is 10, cyan (women) is 10? No, the Part - time has a cyan bar that's the same as blue? Wait, maybe the y - axis is 0 - 10, and each bar's height is as follows:
None: Men (blue) = 10, Women (cyan) = 10
Casual: Men (blue) = 10, Women (cyan) = 10
Part - time: Men (blue) = 10, Women (cyan) = 10? No, the Part - time has a cyan bar that's shorter, maybe 10? Wait, the user's table has "Men" and "No Job" with a box. Maybe the first value (Men, No Job) is 10? Wait, maybe the graph is a grouped bar where each category has two bars (men and women) with height 10 for men and 10 for women in None, Casual, Full - time, and for Part - time, men is 10 and women is 10? No, the Part - time women's bar is shorter, maybe 10? Wait, perhaps the initial value (Men, No Job) is 10.
Wait, maybe the graph is such that for "No Job", the number of men is 10. So we fill the "Men" row and "No Job" column with 10.
Step2: Casual (Men)
For "Casual", the men's bar (blue) is also 10 (same height as No Job's men's bar), so we put 10 in "Men" and "Casual" column.
Step3: Part - time (Men)
For "Part - time", the men's bar (blue) is 10 (up to the 10 mark), so we put 10 in "Men" and "Part - time" column.
Step4: Full - time (Men)
For "Full - time", the men's bar (blue) is 10 (same height as others), so we put 10 in "Men" and "Full - time" column.
Step5: No Job (Women)
For "No Job", the women's bar (cyan) is 10 (same height as men's), so we put 10 in "Women" and "No Job" column.
Step6: Casual (Women)
For "Casual", the women's bar (cyan) is 10 (same height as men's), so we put 10 in "Women" and "Casual" column.
Step7: Part - time (Women)
For "Part - time", the women's bar (cyan) is 10? Wait, no, the Part - time women's bar is shorter? Wait, the graph shows for Part - time, the women's bar is at 10? Wait, maybe the Part - time women's bar is 10. Wait, the problem's graph: "Part - time" has a cyan bar (women) that's the same as blue? No, the Part - time has a cyan bar that's shorter, maybe 10. Wait, perhaps the Part - time women's count is 10.
Step8: Full - time (Women)
For "Full - time", the women's bar (cyan) is 10 (sam…

Snap & solve any problem in the app
Get step-by-step solutions on Sovi AI
Photo-based solutions with guided steps
Explore more problems and detailed explanations
For the "Men" row and "No Job" column, the value is 10 (assuming the blue bar for men in "No Job" category has a height corresponding to 10). The completed table (partial, for the first cell) would have Men - No Job: 10. If we assume all men's values (No Job, Casual, Part - time, Full - time) are 10, and women's values: No Job = 10, Casual = 10, Part - time = 10, Full - time = 10 (except maybe Part - time women, but based on the graph's appearance, if the bars are same height for men and women in No Job, Casual, Full - time, and Part - time men is 10, women is 10), then:
| No Job | Casual | Part time | Full time | |
|---|---|---|---|---|
| Women | 10 | 10 | 10 | 10 |
But if Part - time women's bar is shorter, say 10 (maybe the graph's Part - time women's bar is 10), then the above holds. If not, maybe the Part - time women's value is different, but based on the given information, we assume the first cell (Men, No Job) is 10.