QUESTION IMAGE
Question
activity 2
name
date
period
what about the outputs? (continued)
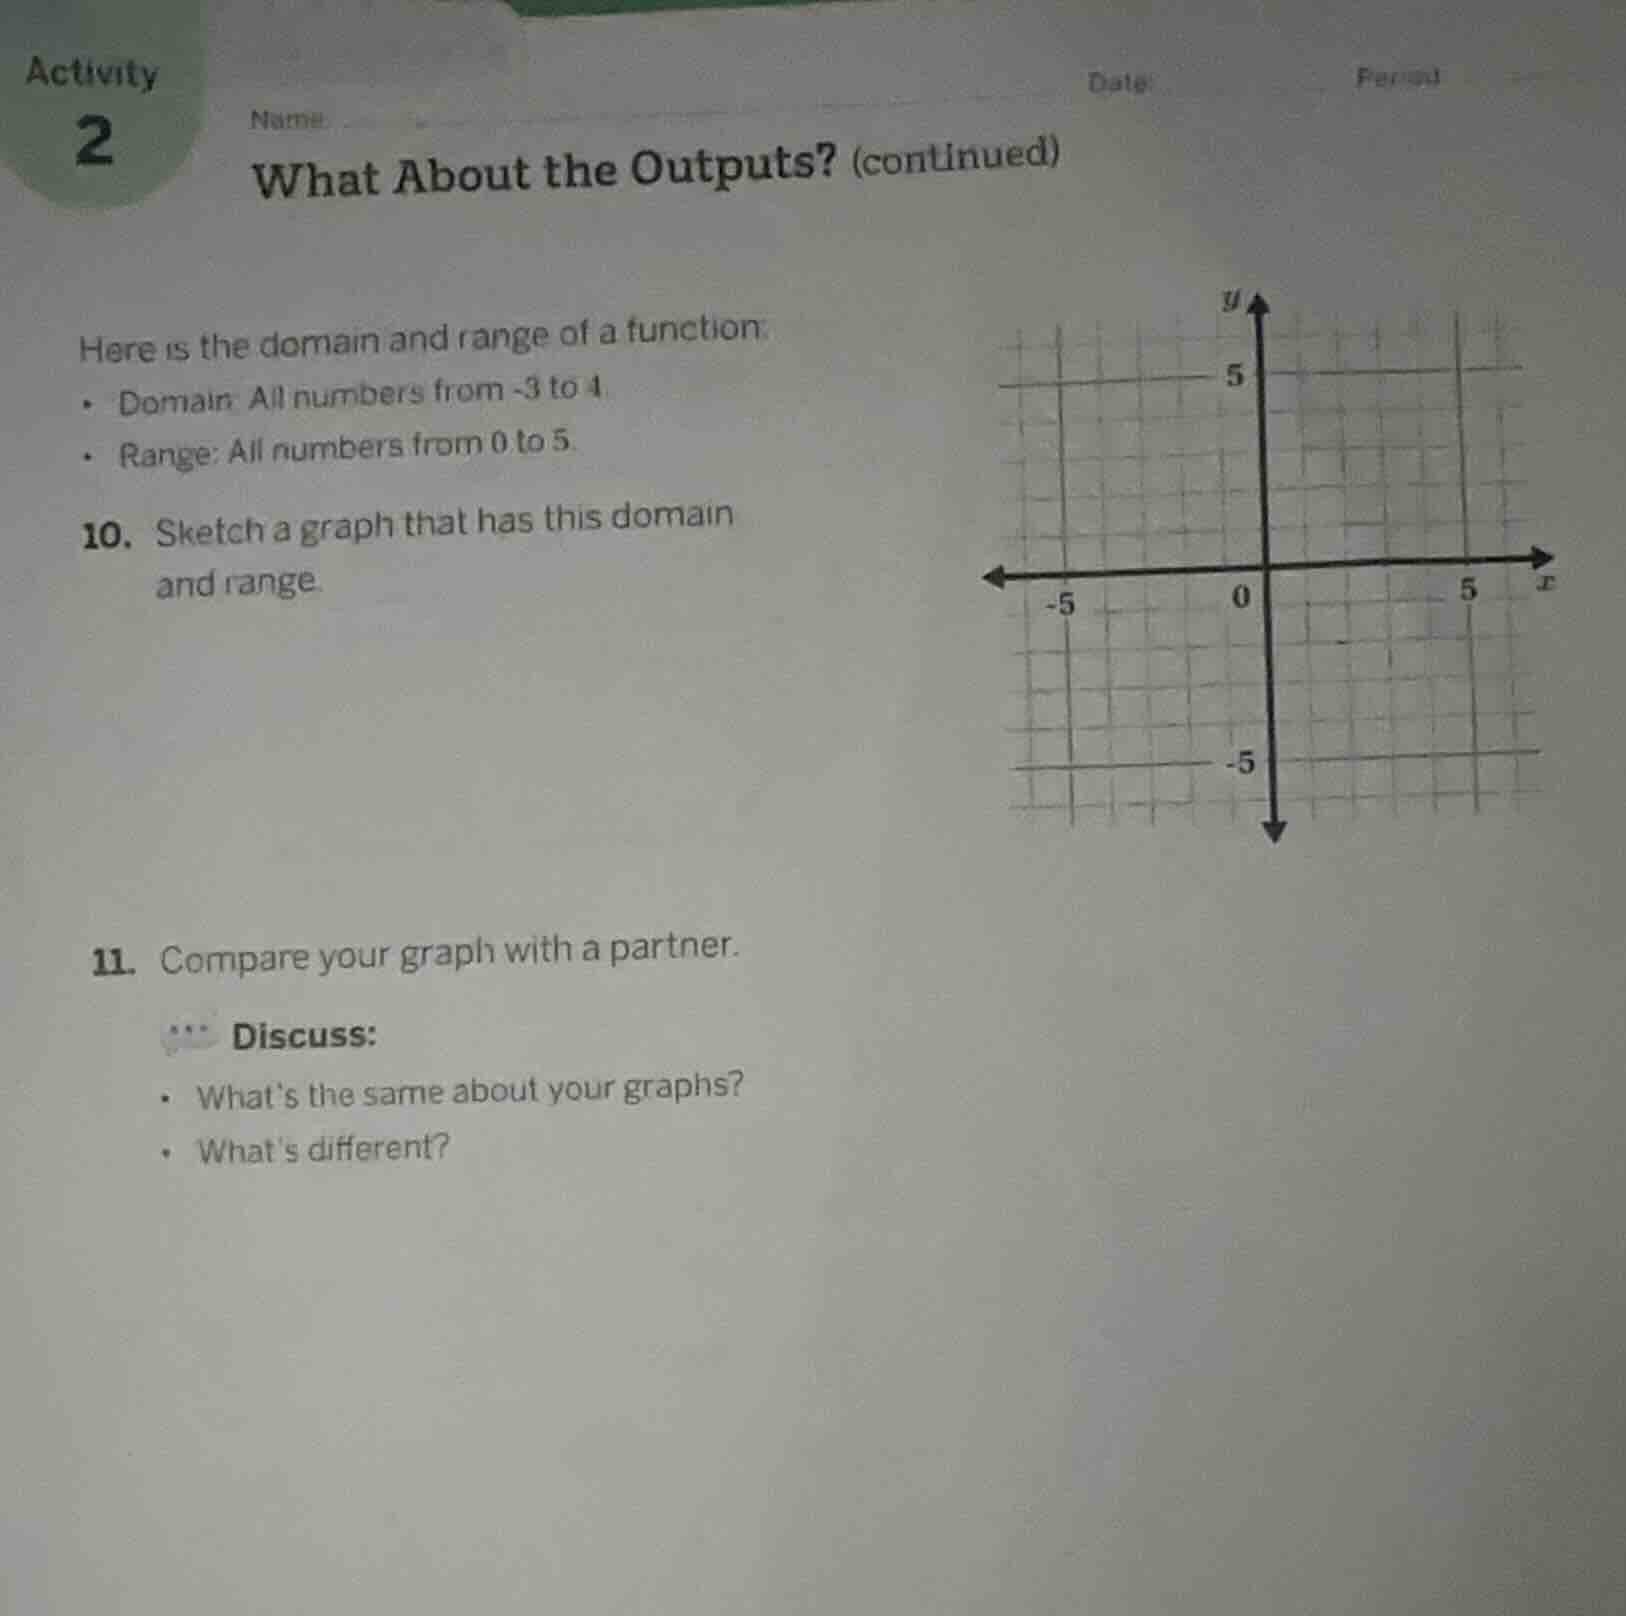
here is the domain and range of a function:
- domain: all numbers from -3 to 4.
- range: all numbers from 0 to 5.
- sketch a graph that has this domain and range.
- compare your graph with a partner.
discuss:
- what’s the same about your graphs?
- what’s different?
Question 10
Step 1: Understand Domain and Range
Domain is \( x \in [-3, 4] \), range is \( y \in [0, 5] \). We can sketch a rectangle or a function (like a vertical line segment, but for a function, use a curve/line). Let's use a rectangle (or a function like a parabola, line, etc.).
Step 2: Plot Key Points
- The leftmost \( x \)-value is \( -3 \), rightmost is \( 4 \).
- The bottom \( y \)-value is \( 0 \), top is \( 5 \).
Step 3: Sketch the Graph
Draw a closed region (or a function) where \( x \) is between \( -3 \) and \( 4 \), and \( y \) is between \( 0 \) and \( 5 \). For a simple graph, a rectangle with vertices at \( (-3, 0) \), \( (4, 0) \), \( (4, 5) \), \( (-3, 5) \) works (or a function like \( y = x + 3 \) from \( x=-3 \) ( \( y=0 \)) to \( x=4 \) ( \( y=7 \)) but adjust to keep \( y \leq 5 \), so maybe \( y = \frac{5}{7}(x + 3) \) to cap at \( y=5 \) when \( x=4 \)).
Question 11
Step 1: Same Aspects
All graphs will have \( x \) between \( -3 \) and \( 4 \), \( y \) between \( 0 \) and \( 5 \). So the domain (horizontal span) and range (vertical span) are identical.
Step 2: Different Aspects
The shape (e.g., a rectangle, a line, a curve, a parabola), specific points (e.g., a graph might pass through \( (0,0) \), another through \( (0,5) \)), or the type of function (relation vs. function, linear vs. non - linear) can differ.

Snap & solve any problem in the app
Get step-by-step solutions on Sovi AI
Photo-based solutions with guided steps
Explore more problems and detailed explanations
10:
A graph (e.g., a rectangle with vertices at \((-3, 0)\), \((4, 0)\), \((4, 5)\), \((-3, 5)\) or a function like \(y=\frac{5}{7}(x + 3)\) for \(x\in[-3,4]\)) is sketched with \(x\) from \(-3\) to \(4\) and \(y\) from \(0\) to \(5\).