QUESTION IMAGE
Question
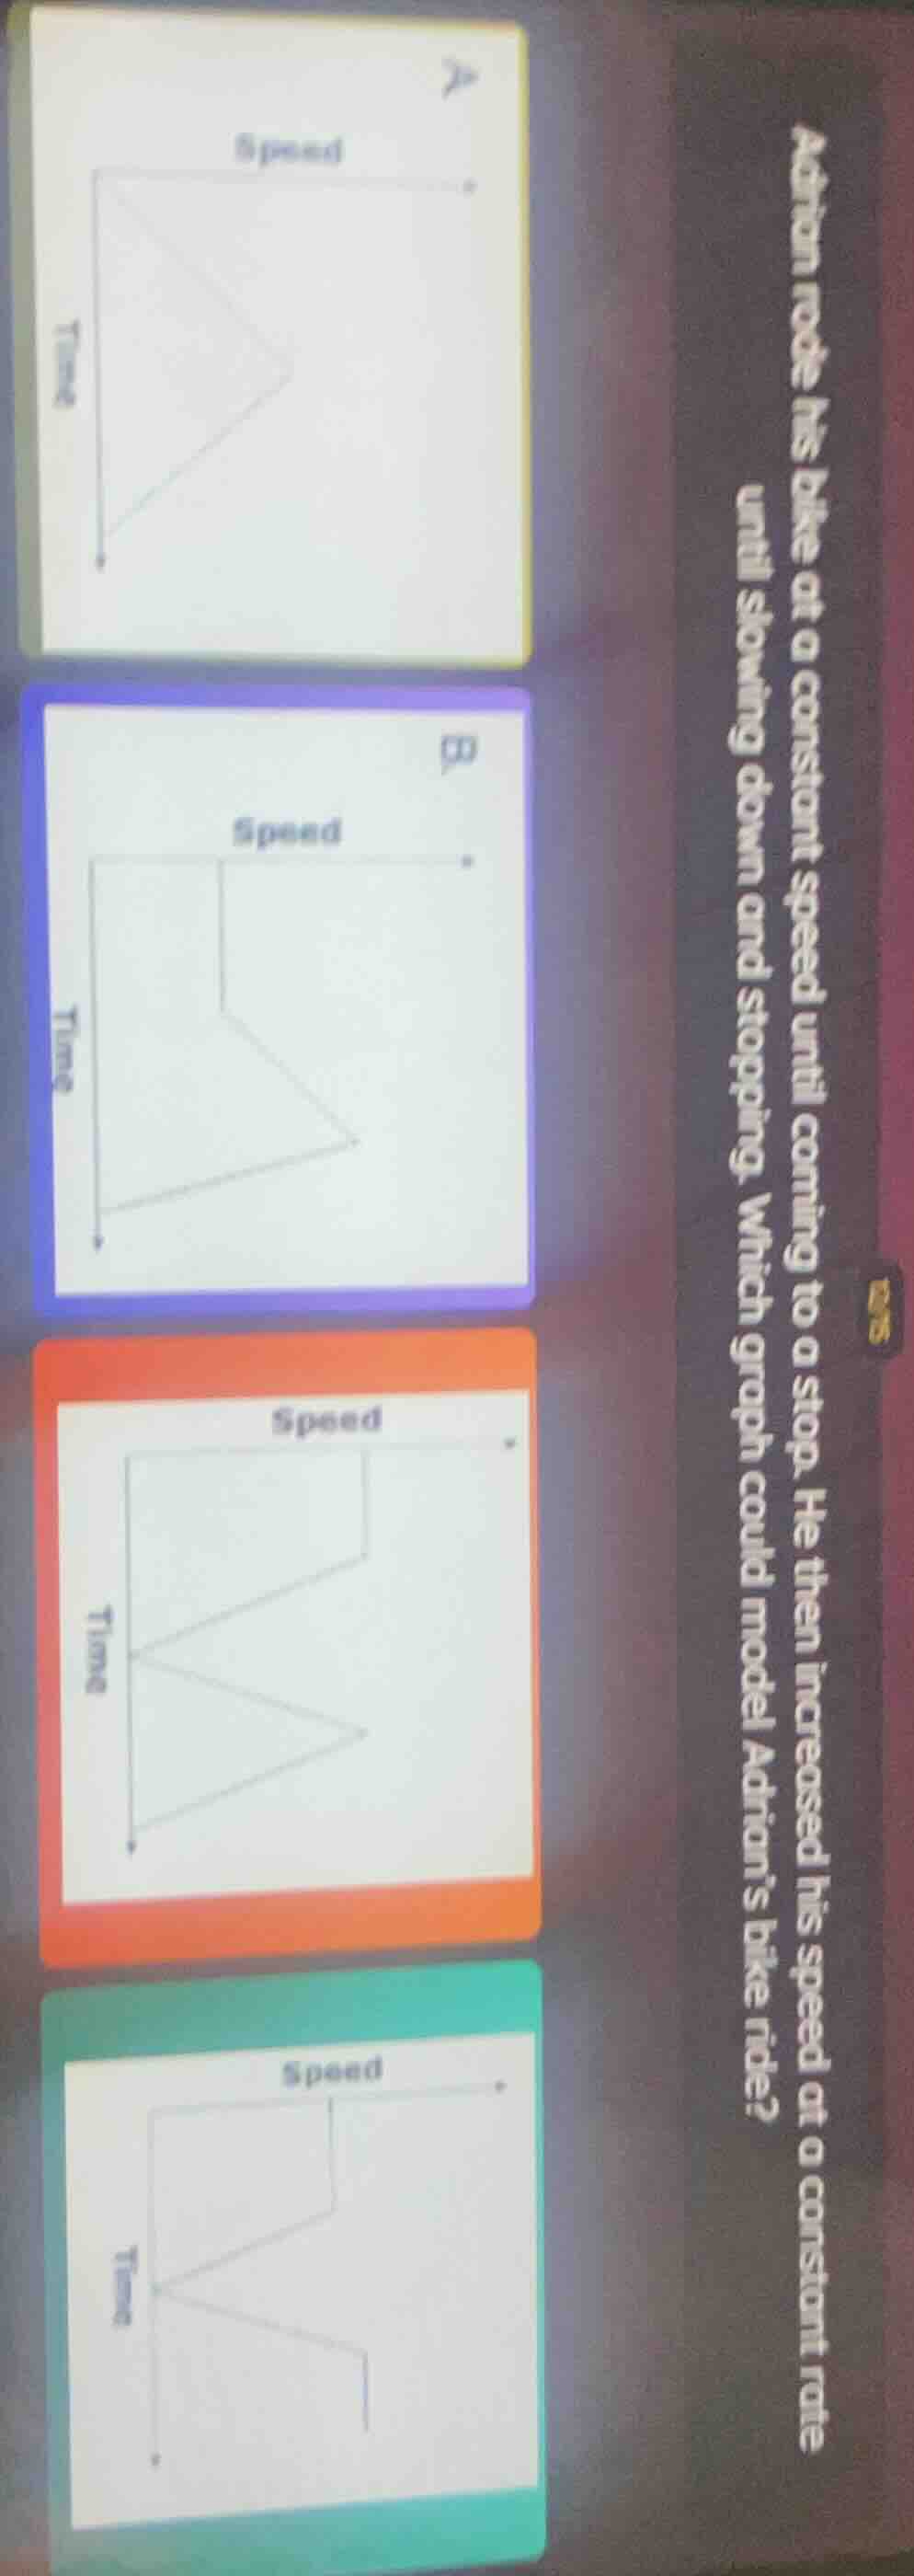
adrian rode his bike at a constant speed until coming to a stop. he then increased his speed at a constant rate until slowing down and stopping. which graph could model adrian’s bike ride?
Adrian's bike ride has three phases: 1) constant speed (horizontal line on speed - time graph), 2) slowing down to stop (line with negative slope), 3) increasing speed at constant rate (line with positive slope). We analyze each graph:
- First graph: Doesn't show the speed increase phase.
- Second graph: Shows constant speed, then slowing to stop, but no speed increase.
- Third graph: Shows constant speed, then slowing to stop, then increasing speed (positive slope).
- Fourth graph: Incorrect slope for the last phase.
So the third graph (orange - colored, assuming the third one is the correct one with the three phases: constant, decrease, increase) models the ride.

Snap & solve any problem in the app
Get step-by-step solutions on Sovi AI
Photo-based solutions with guided steps
Explore more problems and detailed explanations
The third graph (the one with the orange background, showing a horizontal line for constant speed, a line with negative slope for slowing to stop, and a line with positive slope for increasing speed)