QUESTION IMAGE
Question
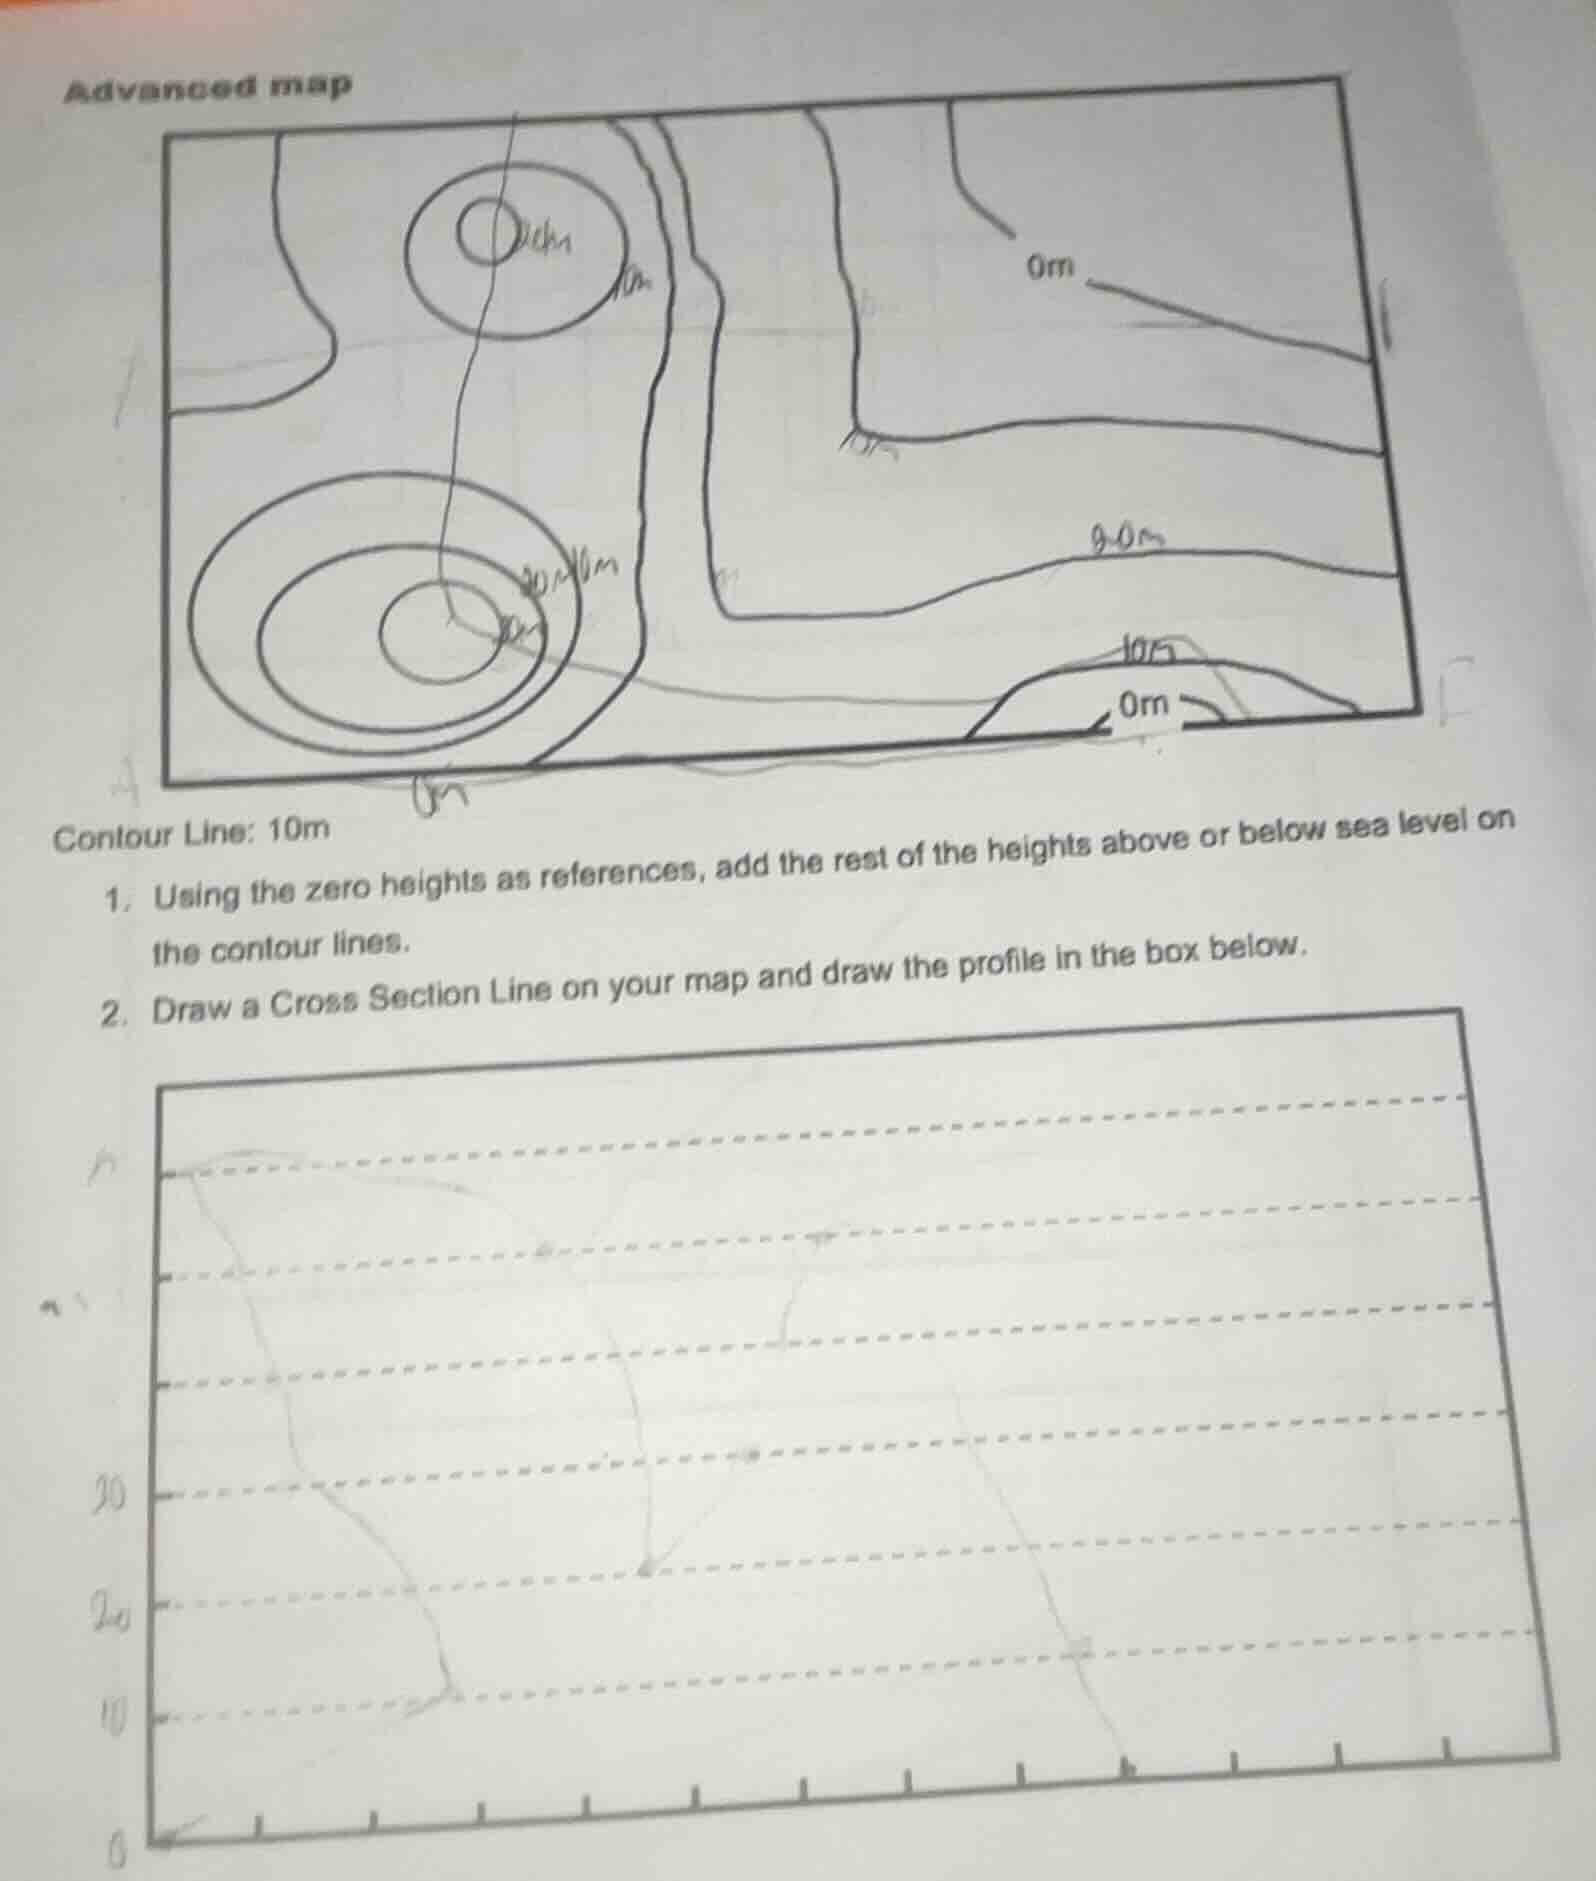
advanced map
contour line: 10m
- using the zero heights as references, add the rest of the heights above or below sea level on the contour lines.
- draw a cross section line on your map and draw the profile in the box below.
Response
Part 1: Assigning Contour Heights
Step 1: Identify Contour Interval
The contour interval is given as \( 10 \, \text{m} \). This means each adjacent contour line differs in height by \( 10 \, \text{m} \).
Step 2: Analyze Elevation Trends (Hills/Depressions)
- Hills: Contour lines form closed loops with increasing height toward the center.
- Depressions: Contour lines form closed loops with decreasing height toward the center (often marked with hachures, but here we use \( 0 \, \text{m} \) as a reference).
For the Lower Left Hill (Closed Loops):
- The outermost contour near \( 0 \, \text{m} \) is \( 10 \, \text{m} \) (since it’s one interval above \( 0 \, \text{m} \)).
- Next inner contour: \( 10 + 10 = 20 \, \text{m} \).
- Innermost contour: \( 20 + 10 = 30 \, \text{m} \).
For the Upper Left Hill (Closed Loops):
- The outermost contour near \( 0 \, \text{m} \) is \( 10 \, \text{m} \).
- Innermost contour: \( 10 + 10 = 20 \, \text{m} \) (assuming one interval between the outer and inner loop).
For the Right - Side Contours:
- The \( 0 \, \text{m} \) reference is given. Moving upward (toward the top of the map), the next contour (above \( 0 \, \text{m} \)) is \( 10 \, \text{m} \), then \( 20 \, \text{m} \), etc. If a contour is below \( 0 \, \text{m} \) (depression), it would be \( - 10 \, \text{m} \), but the map’s context suggests hills here.
Part 2: Drawing a Cross - Section
- Choose a Cross - Section Line: Draw a straight line across the map (e.g., from the lower - left hill to the right - side features) to capture elevation changes.
- Plot Elevations:
- Mark the horizontal distance along the x - axis (from the start of the line to the end).
- For each contour line intersected by the cross - section line, plot the corresponding height (from Part 1) on the y - axis (elevation).
- Connect the plotted points with a smooth line to show the terrain profile (hills will peak, depressions will dip, and flat areas will be horizontal).
Final Answer (for Part 1 Contour Heights):
- Lower left hill contours: \( 10 \, \text{m} \), \( 20 \, \text{m} \), \( 30 \, \text{m} \) (from outer to inner).
- Upper left hill contours: \( 10 \, \text{m} \), \( 20 \, \text{m} \) (from outer to inner).
- Right - side contours (above \( 0 \, \text{m} \)): \( 10 \, \text{m} \), \( 20 \, \text{m} \), etc., based on interval.
(Note: The cross - section drawing requires manual plotting on the provided grid, following the elevation values from the contour analysis.)

Snap & solve any problem in the app
Get step-by-step solutions on Sovi AI
Photo-based solutions with guided steps
Explore more problems and detailed explanations
Step 1: Identify Contour Interval
The contour interval is given as \( 10 \, \text{m} \). This means each adjacent contour line differs in height by \( 10 \, \text{m} \).
Step 2: Analyze Elevation Trends (Hills/Depressions)
- Hills: Contour lines form closed loops with increasing height toward the center.
- Depressions: Contour lines form closed loops with decreasing height toward the center (often marked with hachures, but here we use \( 0 \, \text{m} \) as a reference).
For the Lower Left Hill (Closed Loops):
- The outermost contour near \( 0 \, \text{m} \) is \( 10 \, \text{m} \) (since it’s one interval above \( 0 \, \text{m} \)).
- Next inner contour: \( 10 + 10 = 20 \, \text{m} \).
- Innermost contour: \( 20 + 10 = 30 \, \text{m} \).
For the Upper Left Hill (Closed Loops):
- The outermost contour near \( 0 \, \text{m} \) is \( 10 \, \text{m} \).
- Innermost contour: \( 10 + 10 = 20 \, \text{m} \) (assuming one interval between the outer and inner loop).
For the Right - Side Contours:
- The \( 0 \, \text{m} \) reference is given. Moving upward (toward the top of the map), the next contour (above \( 0 \, \text{m} \)) is \( 10 \, \text{m} \), then \( 20 \, \text{m} \), etc. If a contour is below \( 0 \, \text{m} \) (depression), it would be \( - 10 \, \text{m} \), but the map’s context suggests hills here.
Part 2: Drawing a Cross - Section
- Choose a Cross - Section Line: Draw a straight line across the map (e.g., from the lower - left hill to the right - side features) to capture elevation changes.
- Plot Elevations:
- Mark the horizontal distance along the x - axis (from the start of the line to the end).
- For each contour line intersected by the cross - section line, plot the corresponding height (from Part 1) on the y - axis (elevation).
- Connect the plotted points with a smooth line to show the terrain profile (hills will peak, depressions will dip, and flat areas will be horizontal).
Final Answer (for Part 1 Contour Heights):
- Lower left hill contours: \( 10 \, \text{m} \), \( 20 \, \text{m} \), \( 30 \, \text{m} \) (from outer to inner).
- Upper left hill contours: \( 10 \, \text{m} \), \( 20 \, \text{m} \) (from outer to inner).
- Right - side contours (above \( 0 \, \text{m} \)): \( 10 \, \text{m} \), \( 20 \, \text{m} \), etc., based on interval.
(Note: The cross - section drawing requires manual plotting on the provided grid, following the elevation values from the contour analysis.)