QUESTION IMAGE
Question
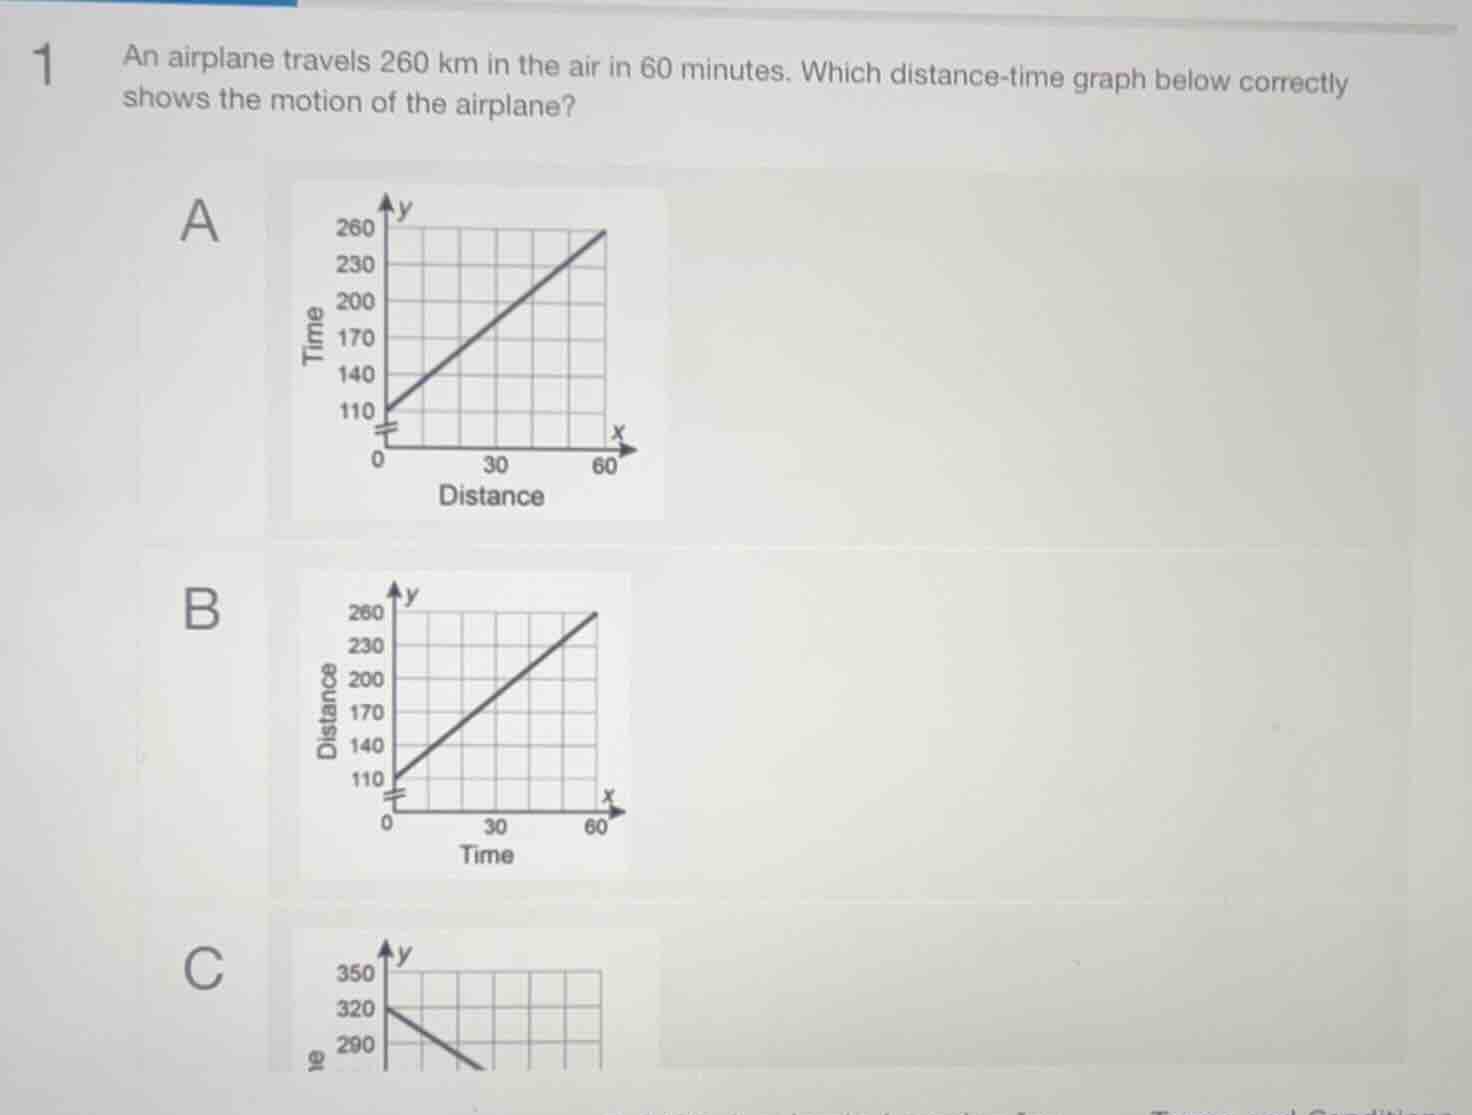
1 an airplane travels 260 km in the air in 60 minutes. which distance-time graph below correctly shows the motion of the airplane?
Step1: Identify graph axes requirements
A distance-time graph has distance (y-axis) vs. time (x-axis), with distance increasing as time passes.
Step2: Analyze given motion data
The airplane travels 260 km (distance) over 60 minutes (time), starting from 0 distance at 0 time (implied, as it travels the 260 km in the 60 minutes).
Step3: Evaluate each option
- Option A: Has time on y-axis, distance on x-axis (incorrect axis assignment).
- Option B: Has distance on y-axis, time on x-axis, with distance increasing to 260 as time reaches 60 (matches the motion).
- Option C: Shows decreasing distance (contradicts the airplane's forward motion).

Snap & solve any problem in the app
Get step-by-step solutions on Sovi AI
Photo-based solutions with guided steps
Explore more problems and detailed explanations
B. Distance-time graph with Distance on y-axis, Time on x-axis, increasing to 260 at 60 minutes