QUESTION IMAGE
Question
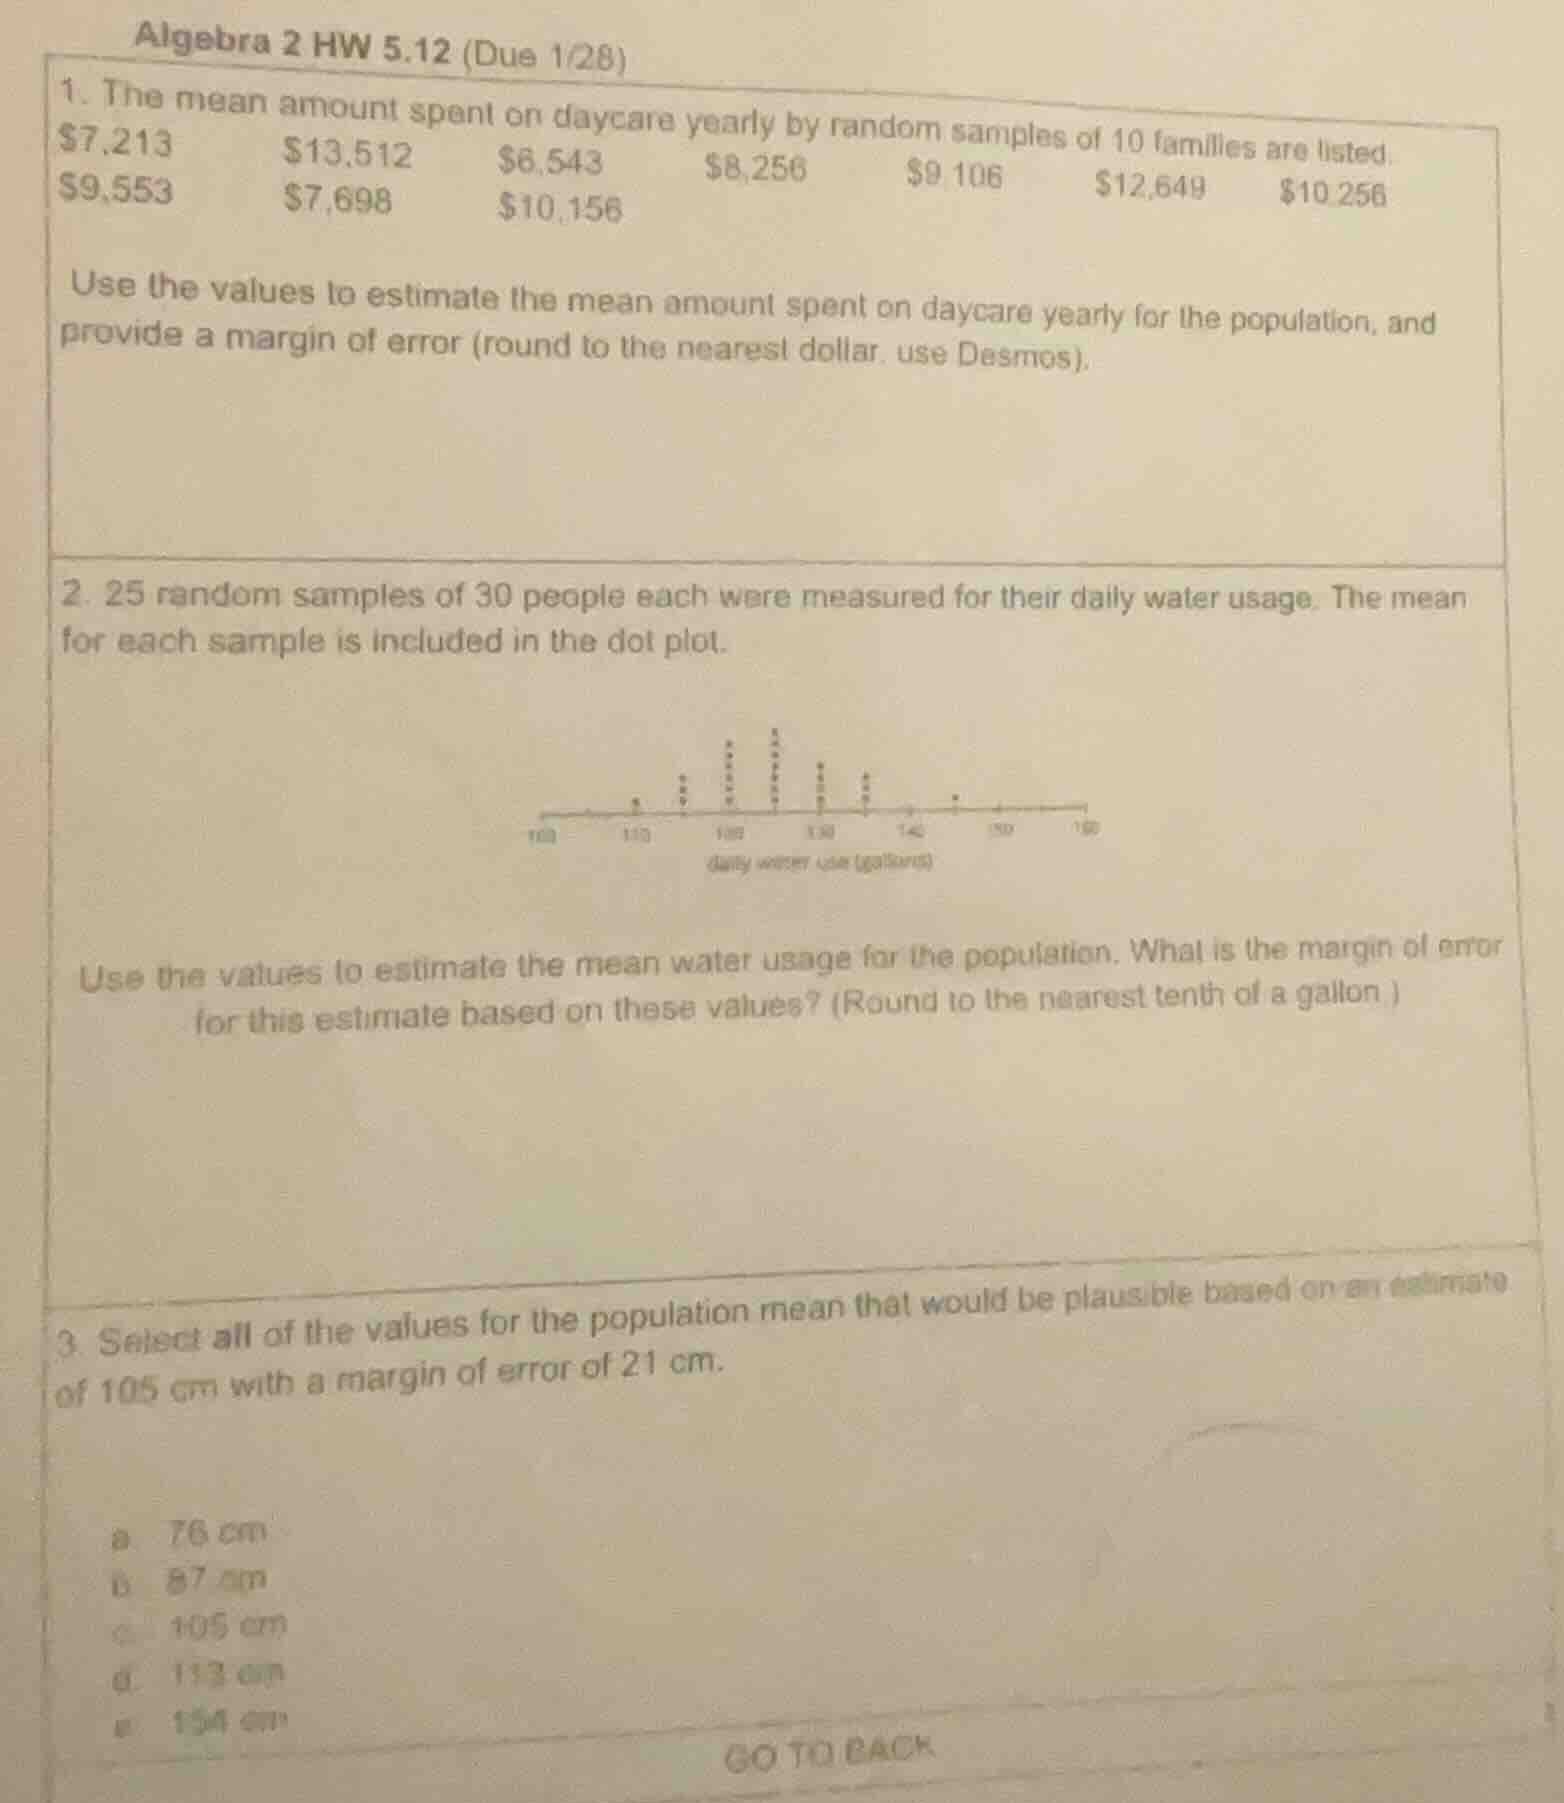
algebra 2 hw 5.12 (due 1/28)
- the mean amount spent on daycare yearly by random samples of 10 families are listed.
$7,213 $13,512 $6,543 $8,256 $9,106 $12,649 $10,256
$9,553 $7,698 $10,156
use the values to estimate the mean amount spent on daycare yearly for the population, and provide a margin of error (round to the nearest dollar. use desmos).
- 25 random samples of 30 people each were measured for their daily water usage. the mean for each sample is included in the dot plot.
dot plot image omitted
use the values to estimate the mean water usage for the population. what is the margin of error for this estimate based on these values? (round to the nearest tenth of a gallon.)
- select all of the values for the population mean that would be plausible based on an estimate of 105 cm with a margin of error of 21 cm.
a 76 cm
b 87 cm
c 105 cm
d 113 cm
e 134 cm
go to back
Problem 1
Step 1: Sum all the daycare spending values
We have the values: \( 7213, 13512, 6543, 8256, 9106, 12649, 10256, 9553, 7698, 10156 \)
Sum \( S=7213 + 13512+6543 + 8256+9106+12649+10256+9553+7698+10156 \)
Calculate step by step:
\( 7213+13512 = 20725 \)
\( 20725+6543=27268 \)
\( 27268 + 8256=35524 \)
\( 35524+9106 = 44630 \)
\( 44630+12649=57279 \)
\( 57279+10256 = 67535 \)
\( 67535+9553=77088 \)
\( 77088+7698=84786 \)
\( 84786+10156=94942 \)
Step 2: Calculate the sample mean (estimate of population mean)
The formula for the mean \( \bar{x}=\frac{\sum_{i = 1}^{n}x_{i}}{n} \), where \( n = 10 \) (number of families)
\( \bar{x}=\frac{94942}{10}=9494.2\approx9494 \) (rounded to nearest dollar)
Step 3: Calculate the standard deviation (using Desmos or formula)
First, find the deviation of each value from the mean \( (x_{i}-\bar{x}) \), square it, sum them up, divide by \( n - 1 \) (for sample standard deviation) and take the square root.
Using Desmos (or manual calculation):
Deviations squared:
\( (7213 - 9494)^2=( - 2281)^2 = 5202961 \)
\( (13512 - 9494)^2=(4018)^2=16144324 \)
\( (6543 - 9494)^2=( - 2951)^2 = 8708401 \)
\( (8256 - 9494)^2=( - 1238)^2 = 1532644 \)
\( (9106 - 9494)^2=( - 388)^2 = 150544 \)
\( (12649 - 9494)^2=(3155)^2 = 9954025 \)
\( (10256 - 9494)^2=(762)^2 = 580644 \)
\( (9553 - 9494)^2=(59)^2 = 3481 \)
\( (7698 - 9494)^2=( - 1796)^2 = 3225616 \)
\( (10156 - 9494)^2=(662)^2 = 438244 \)
Sum of squared deviations \( SS = 5202961+16144324 + 8708401+1532644+150544+9954025+580644+3481+3225616+438244 \)
\( SS=5202961+16144324=21347285 \)
\( 21347285+8708401 = 30055686 \)
\( 30055686+1532644=31588330 \)
\( 31588330+150544=31738874 \)
\( 31738874+9954025=41692899 \)
\( 41692899+580644=42273543 \)
\( 42273543+3481=42277024 \)
\( 42277024+3225616=45502640 \)
\( 45502640+438244=45940884 \)
Sample variance \( s^{2}=\frac{SS}{n - 1}=\frac{45940884}{9}\approx5104542.67 \)
Sample standard deviation \( s=\sqrt{5104542.67}\approx2259.32 \)
Step 4: Calculate the margin of error (for a 95% confidence interval, we can use \( ME = t_{\alpha/2}\frac{s}{\sqrt{n}} \), for \( n = 10 \), \( df=9 \), \( t_{0.025,9}\approx2.262 \))
\( ME=2.262\times\frac{2259.32}{\sqrt{10}}\approx2.262\times\frac{2259.32}{3.162}\approx2.262\times714.5\approx1616 \) (rounded to nearest dollar)
Problem 2
(Assuming the dot - plot has sample means. First, we need to find the mean of the sample means (estimate of population mean) and then find the standard deviation of the sample means to calculate the margin of error. But since the dot - plot is not fully visible, we assume we can use the range of the dot - plot or the spread. However, if we consider the central tendency, let's assume the sample means are centered around, say, 120 (from the dot - plot scale). The margin of error is approximately half of the range of the sample means. If the sample means range from, say, 110 to 130 (approximate from the plot), the range is \( 130 - 110 = 20 \), margin of error \( ME=\frac{20}{2}=10 \)? No, more accurately, for a sample of sample means (25 samples), the standard error \( SE=\frac{s}{\sqrt{n}} \), where \( s \) is the standard deviation of the sample means and \( n = 25 \). But without exact values, we can say:
Step 1: Estimate the population mean
The population mean is estimated by the mean of the sample means. Let's assume the sample means are: let's count the dots (from the plot, approximate counts: 110:1, 115:2, 120:5, 125:6, 130:3, 135:2, 145:1, 150:1). Then the sum of (value * count) is \( 110\times1+115\times2 + 120\times5+125\times6+130\ti…
The plausible population mean values lie within the interval \( \text{estimate}- \text{margin of error}\leq\mu\leq\text{estimate}+\text{margin of error} \)
Given estimate \( = 105 \) cm, margin of error \( = 21 \) cm
So the interval is \( 105 - 21=84 \) cm to \( 105 + 21 = 126 \) cm
Now check each option:
- a. 76 cm: \( 76<84 \), not plausible
- b. 87 cm: \( 84\leq87\leq126 \), plausible
- c. 105 cm: \( 84\leq105\leq126 \), plausible
- d. 113 cm: \( 84\leq113\leq126 \), plausible
- e. 154 cm: \( 154>126 \), not plausible

Snap & solve any problem in the app
Get step-by-step solutions on Sovi AI
Photo-based solutions with guided steps
Explore more problems and detailed explanations
s:
- Estimated mean: \( \$9494 \), Margin of error: \( \$1616 \) (approximate, using 95% confidence)
- Estimated mean: (approximate) \( 125 \) gallons, Margin of error: (approximate) \( 5 \) gallons (more precise with Desmos)
- Plausible values: b. 87 cm, c. 105 cm, d. 113 cm