QUESTION IMAGE
Question
all year:
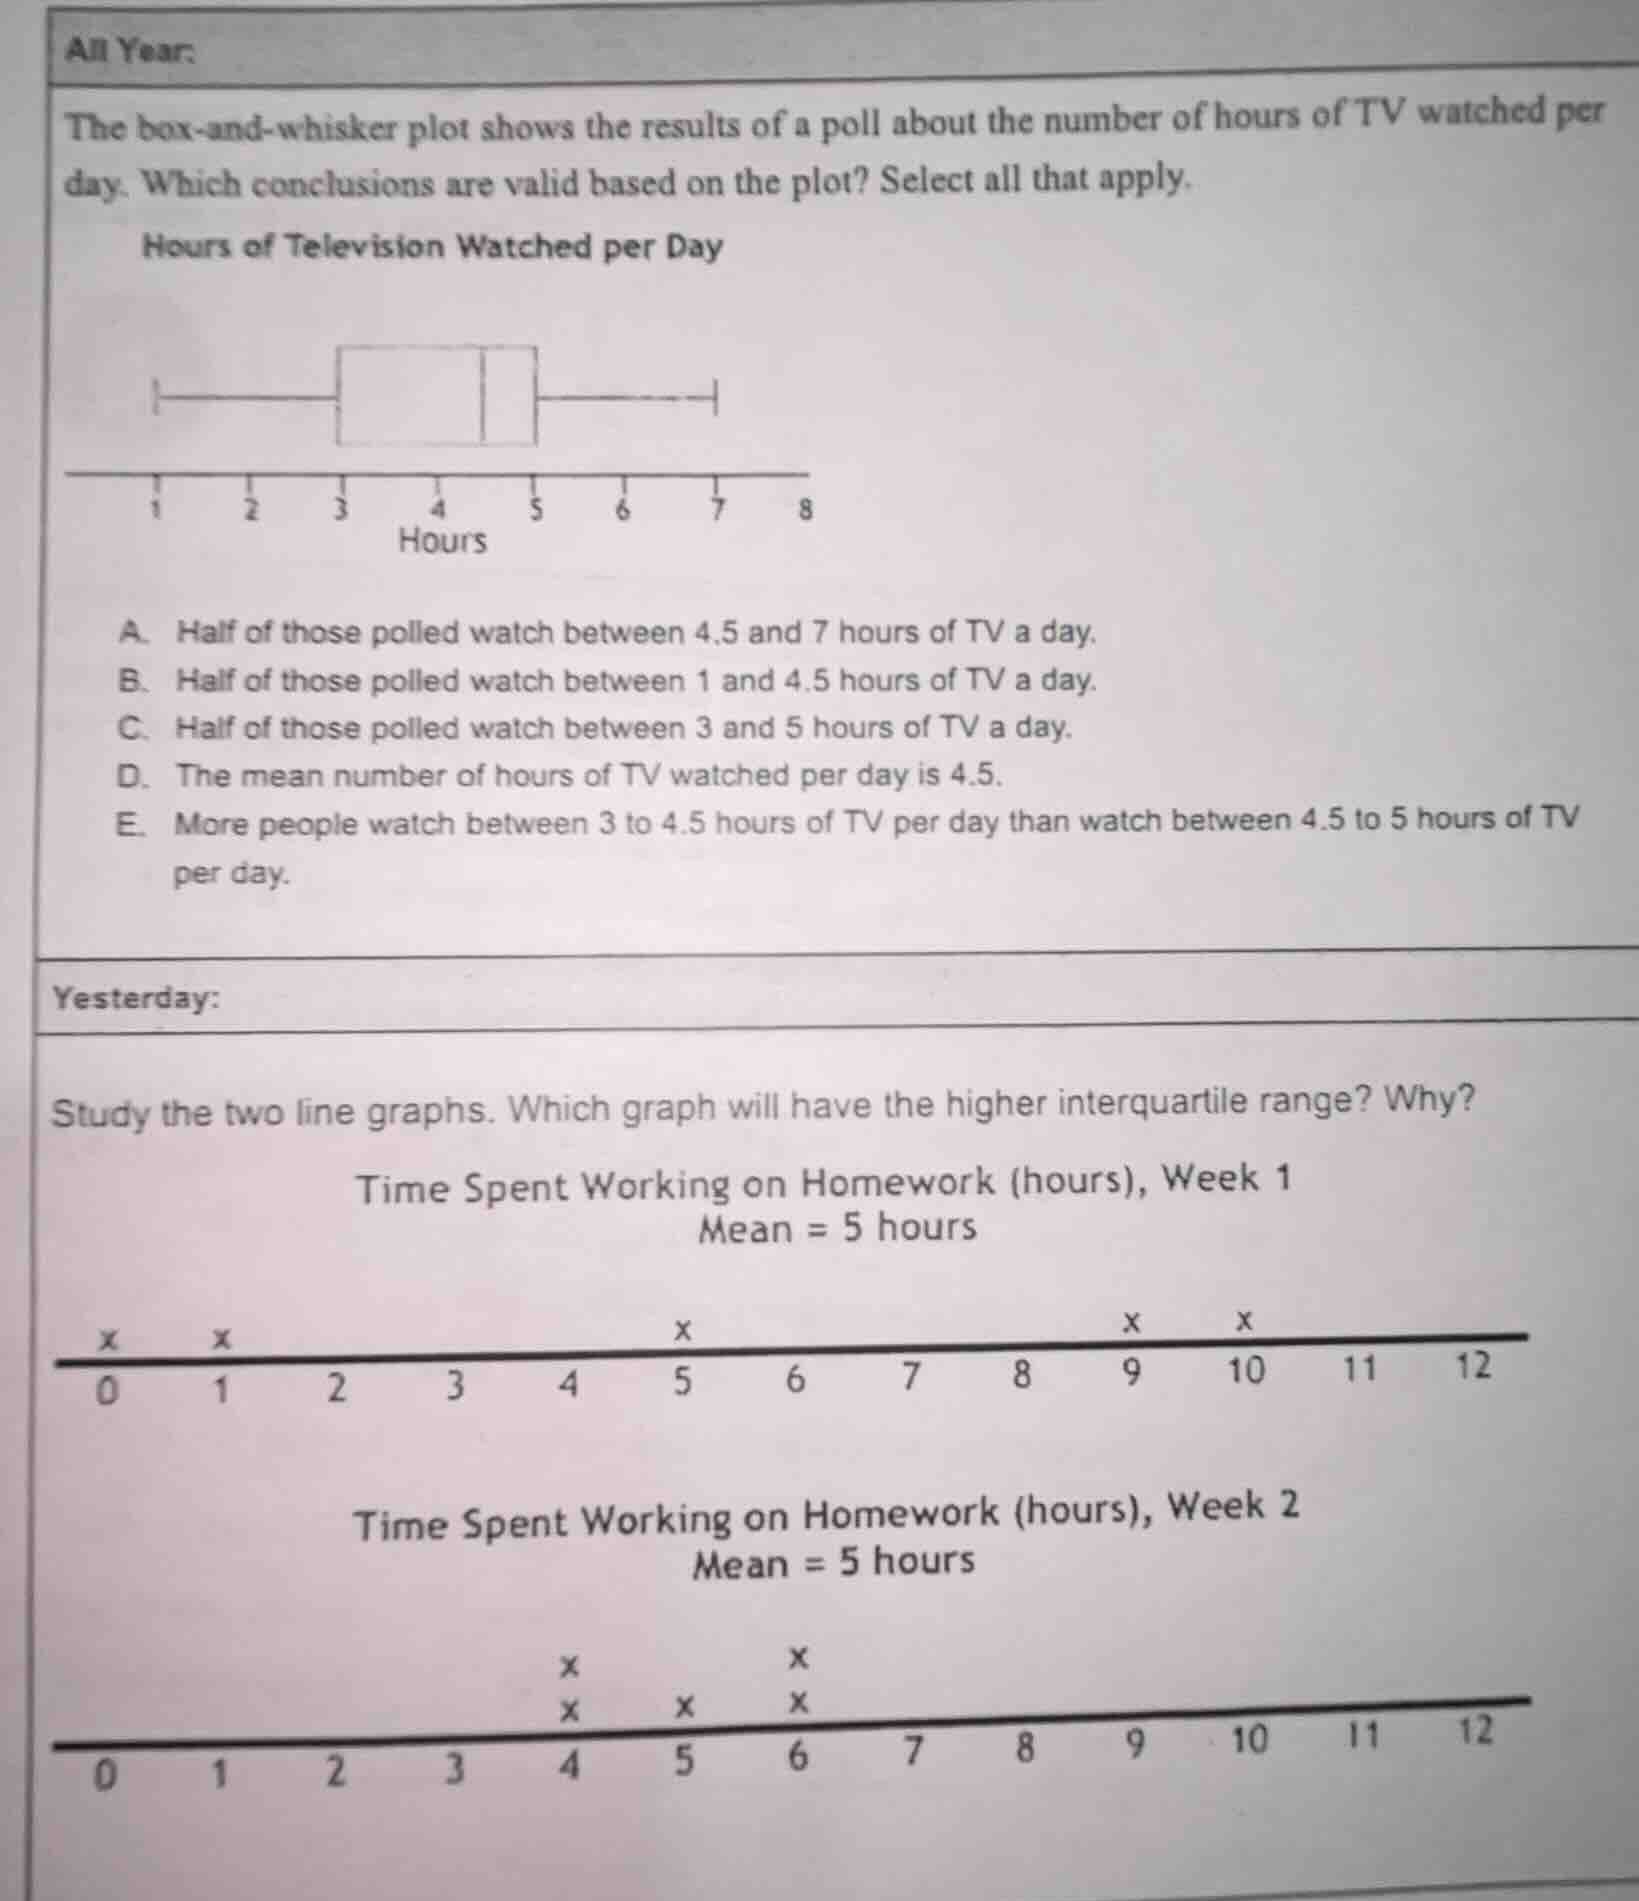
the box - and - whisker plot shows the results of a poll about the number of hours of tv watched per day. which conclusions are valid based on the plot? select all that apply.
hours of television watched per day
(box - and - whisker plot image with number line from 1 to 8, labeled hours)
a. half of those polled watch between 4.5 and 7 hours of tv a day.
b. half of those polled watch between 1 and 4.5 hours of tv a day.
c. half of those polled watch between 3 and 5 hours of tv a day.
d. the mean number of hours of tv watched per day is 4.5.
e. more people watch between 3 to 4.5 hours of tv per day than watch between 4.5 to 5 hours of tv per day.
yesterday:
study the two line graphs. which graph will have the higher interquartile range? why?
time spent working on homework (hours), week 1
mean = 5 hours
(line graph with xs at 0, 1, 5, 9, 10)
time spent working on homework (hours), week 2
mean = 5 hours
(line graph with xs at 4, 4, 5, 6, 6)

Snap & solve any problem in the app
Get step-by-step solutions on Sovi AI
Photo-based solutions with guided steps
Explore more problems and detailed explanations
C. Half of those polled watch between 3 and 5 hours of TV a day.
E. More people watch between 3 to 4.5 hours of TV per day than watch between 4.5 to 5 hours of TV per day.
Week 1 will have the higher interquartile range, because its data is more spread out than Week 2's data.