QUESTION IMAGE
Question
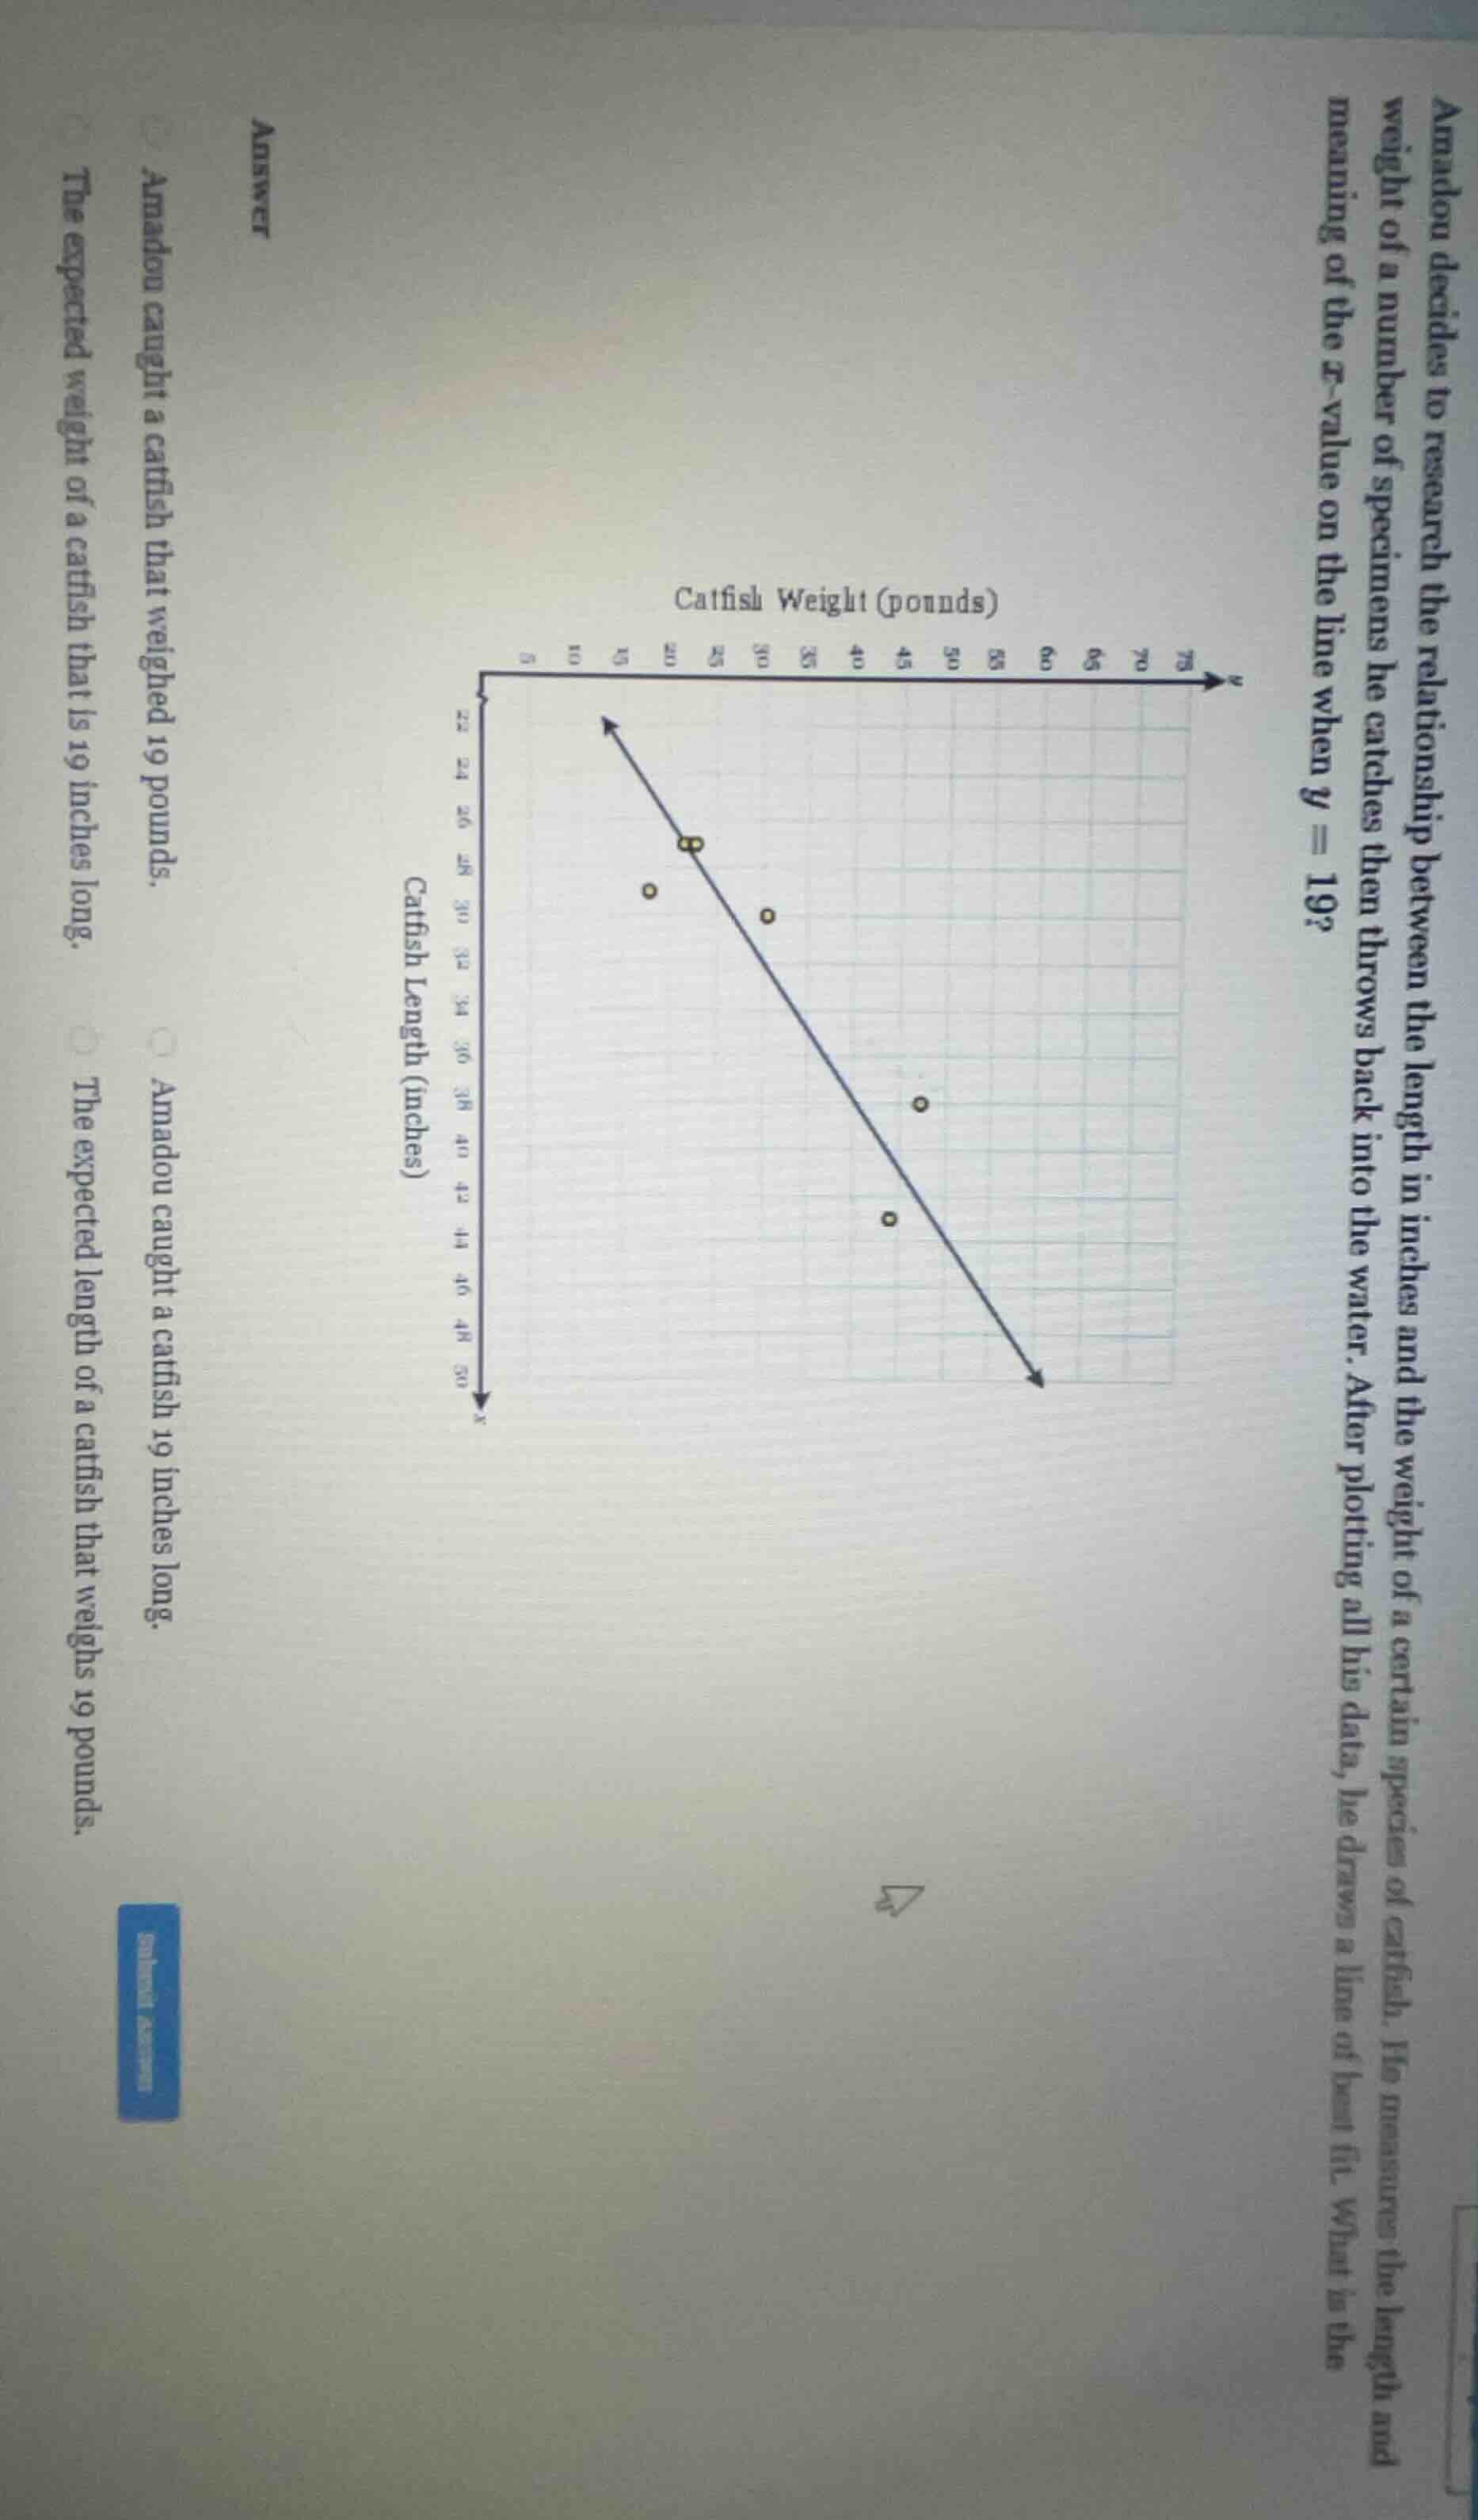
amadou decides to research the relationship between the length in inches and the weight of a number of specimens he catches then throws back into the water. after plotting all his data, he draws a line of best fit. what is the meaning of the x - value on the line when y = 19?
options:
- amadou caught a catfish that weighed 19 pounds.
- amadou caught a catfish 19 inches long.
- the expected weight of a catfish that is 19 inches long.
- the expected length of a catfish that weighs 19 pounds.
(chart: catfish weight (pounds) on y - axis, catfish length (inches) on x - axis, with a line of best fit and data points)
The line of best fit represents the expected relationship between catfish length ($x$, inches) and weight ($y$, pounds). When $y=19$, we are finding the $x$-value that corresponds to this weight on the trend line, which is the predicted length for a catfish that weighs 19 pounds. The data points are individual caught fish, but the line of best fit gives expected values, not actual caught specimens.

Snap & solve any problem in the app
Get step-by-step solutions on Sovi AI
Photo-based solutions with guided steps
Explore more problems and detailed explanations
The expected length of a catfish that weighs 19 pounds.