QUESTION IMAGE
Question
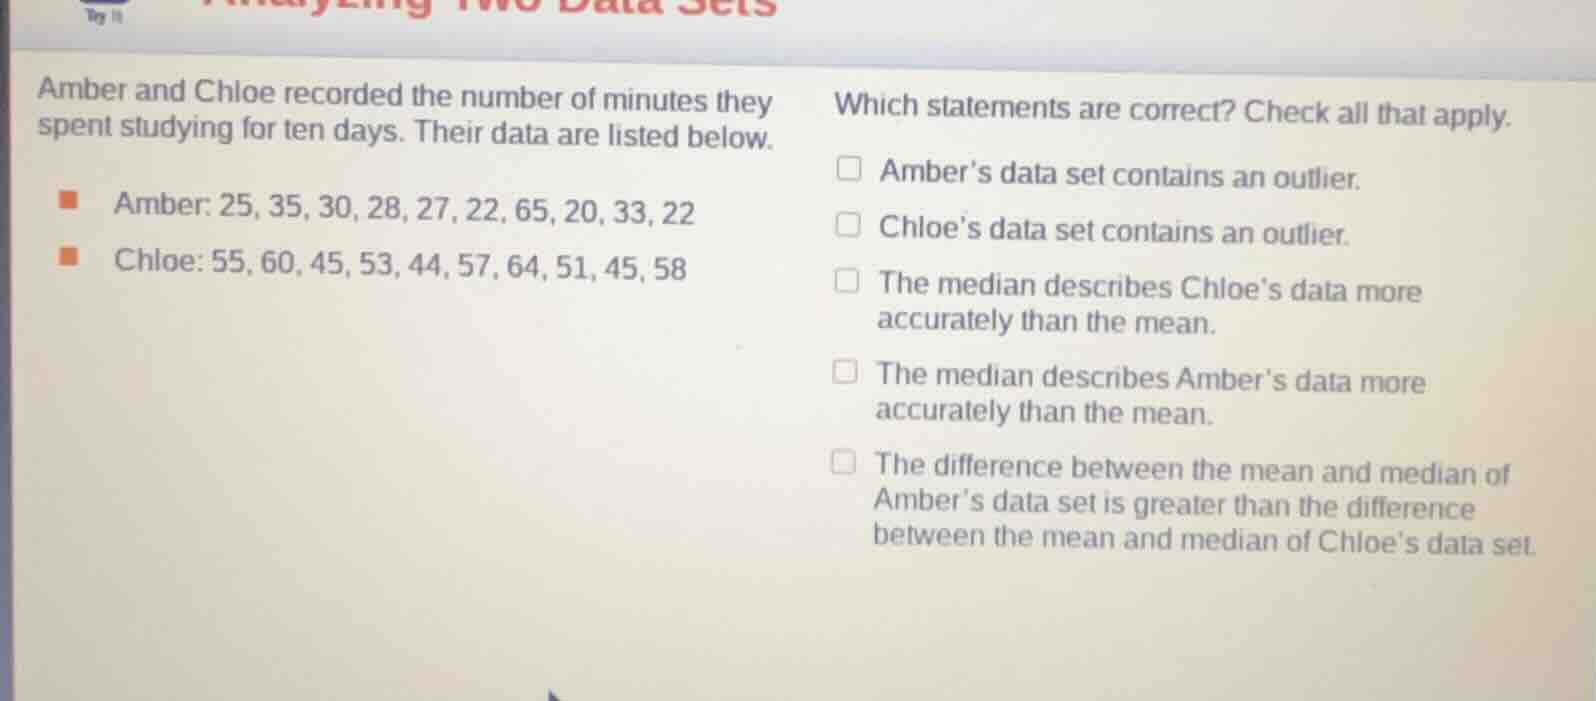
amber and chloe recorded the number of minutes they spent studying for ten days. their data are listed below. amber: 25, 35, 30, 28, 27, 22, 65, 20, 33, 22 chloe: 55, 60, 45, 53, 44, 57, 64, 51, 45, 58 which statements are correct? check all that apply. amber’s data set contains an outlier. chloe’s data set contains an outlier. the median describes chloe’s data more accurately than the mean. the median describes amber’s data more accurately than the mean. the difference between the mean and median of amber’s data set is greater than the difference between the mean and median of chloe’s data set.
Step1: Analyze Amber's data for outliers
First, we sort Amber's data: \(20, 22, 22, 25, 27, 28, 30, 33, 35, 65\). To find outliers, we can use the interquartile range (IQR) method. First, find the median (Q2) of the data. Since there are 10 data points, the median is the average of the 5th and 6th values: \(\frac{27 + 28}{2}=27.5\). The first quartile (Q1) is the median of the lower half (\(20, 22, 22, 25, 27\)), which is \(22\). The third quartile (Q3) is the median of the upper half (\(28, 30, 33, 35, 65\)), which is \(33\). The IQR is \(Q3 - Q1 = 33 - 22 = 11\). The lower bound for non - outliers is \(Q1 - 1.5\times IQR=22 - 1.5\times11 = 22 - 16.5 = 5.5\), and the upper bound is \(Q3+1.5\times IQR = 33+1.5\times11=33 + 16.5 = 49.5\). The value \(65\) is greater than \(49.5\), so Amber's data has an outlier.
Step2: Analyze Chloe's data for outliers
Sort Chloe's data: \(44, 45, 45, 51, 53, 55, 57, 58, 60, 64\). The median (Q2) is the average of the 5th and 6th values: \(\frac{53 + 55}{2}=54\). The first quartile (Q1) is the median of the lower half (\(44, 45, 45, 51, 53\)), which is \(45\). The third quartile (Q3) is the median of the upper half (\(55, 57, 58, 60, 64\)), which is \(58\). The IQR is \(Q3 - Q1=58 - 45 = 13\). The lower bound is \(Q1-1.5\times IQR = 45-1.5\times13=45 - 19.5 = 25.5\), and the upper bound is \(Q3 + 1.5\times IQR=58+1.5\times13=58 + 19.5 = 77.5\). All of Chloe's data points are within \([25.5, 77.5]\), so Chloe's data has no outlier.
Step3: Analyze mean and median for Amber's data
For Amber's data, the outlier (\(65\)) will affect the mean. The mean of Amber's data: \(\frac{20 + 22+22 + 25+27+28+30+33+35+65}{10}=\frac{317}{10}=31.7\). The median is \(27.5\). Since there is an outlier, the median (which is resistant to outliers) describes the data better than the mean.
Step4: Analyze mean and median for Chloe's data
For Chloe's data, there is no outlier. The mean of Chloe's data: \(\frac{44 + 45+45+51+53+55+57+58+60+64}{10}=\frac{532}{10}=53.2\). The median is \(54\). Since there is no outlier, the mean and median are close, and the median does not describe the data "more accurately" than the mean (in fact, the mean is also a good measure here).
Step5: Analyze the difference between mean and median
For Amber: \(|31.7 - 27.5| = 4.2\)
For Chloe: \(|53.2 - 54|=0.8\)
Since \(4.2>0.8\), the difference between the mean and median of Amber's data set is greater than that of Chloe's.

Snap & solve any problem in the app
Get step-by-step solutions on Sovi AI
Photo-based solutions with guided steps
Explore more problems and detailed explanations
Amber’s data set contains an outlier.
The median describes Amber’s data more accurately than the mean.
The difference between the mean and median of Amber’s data set is greater than the difference between the mean and median of Chloe’s data set.