QUESTION IMAGE
Question
analyzing graphs of linear relationships
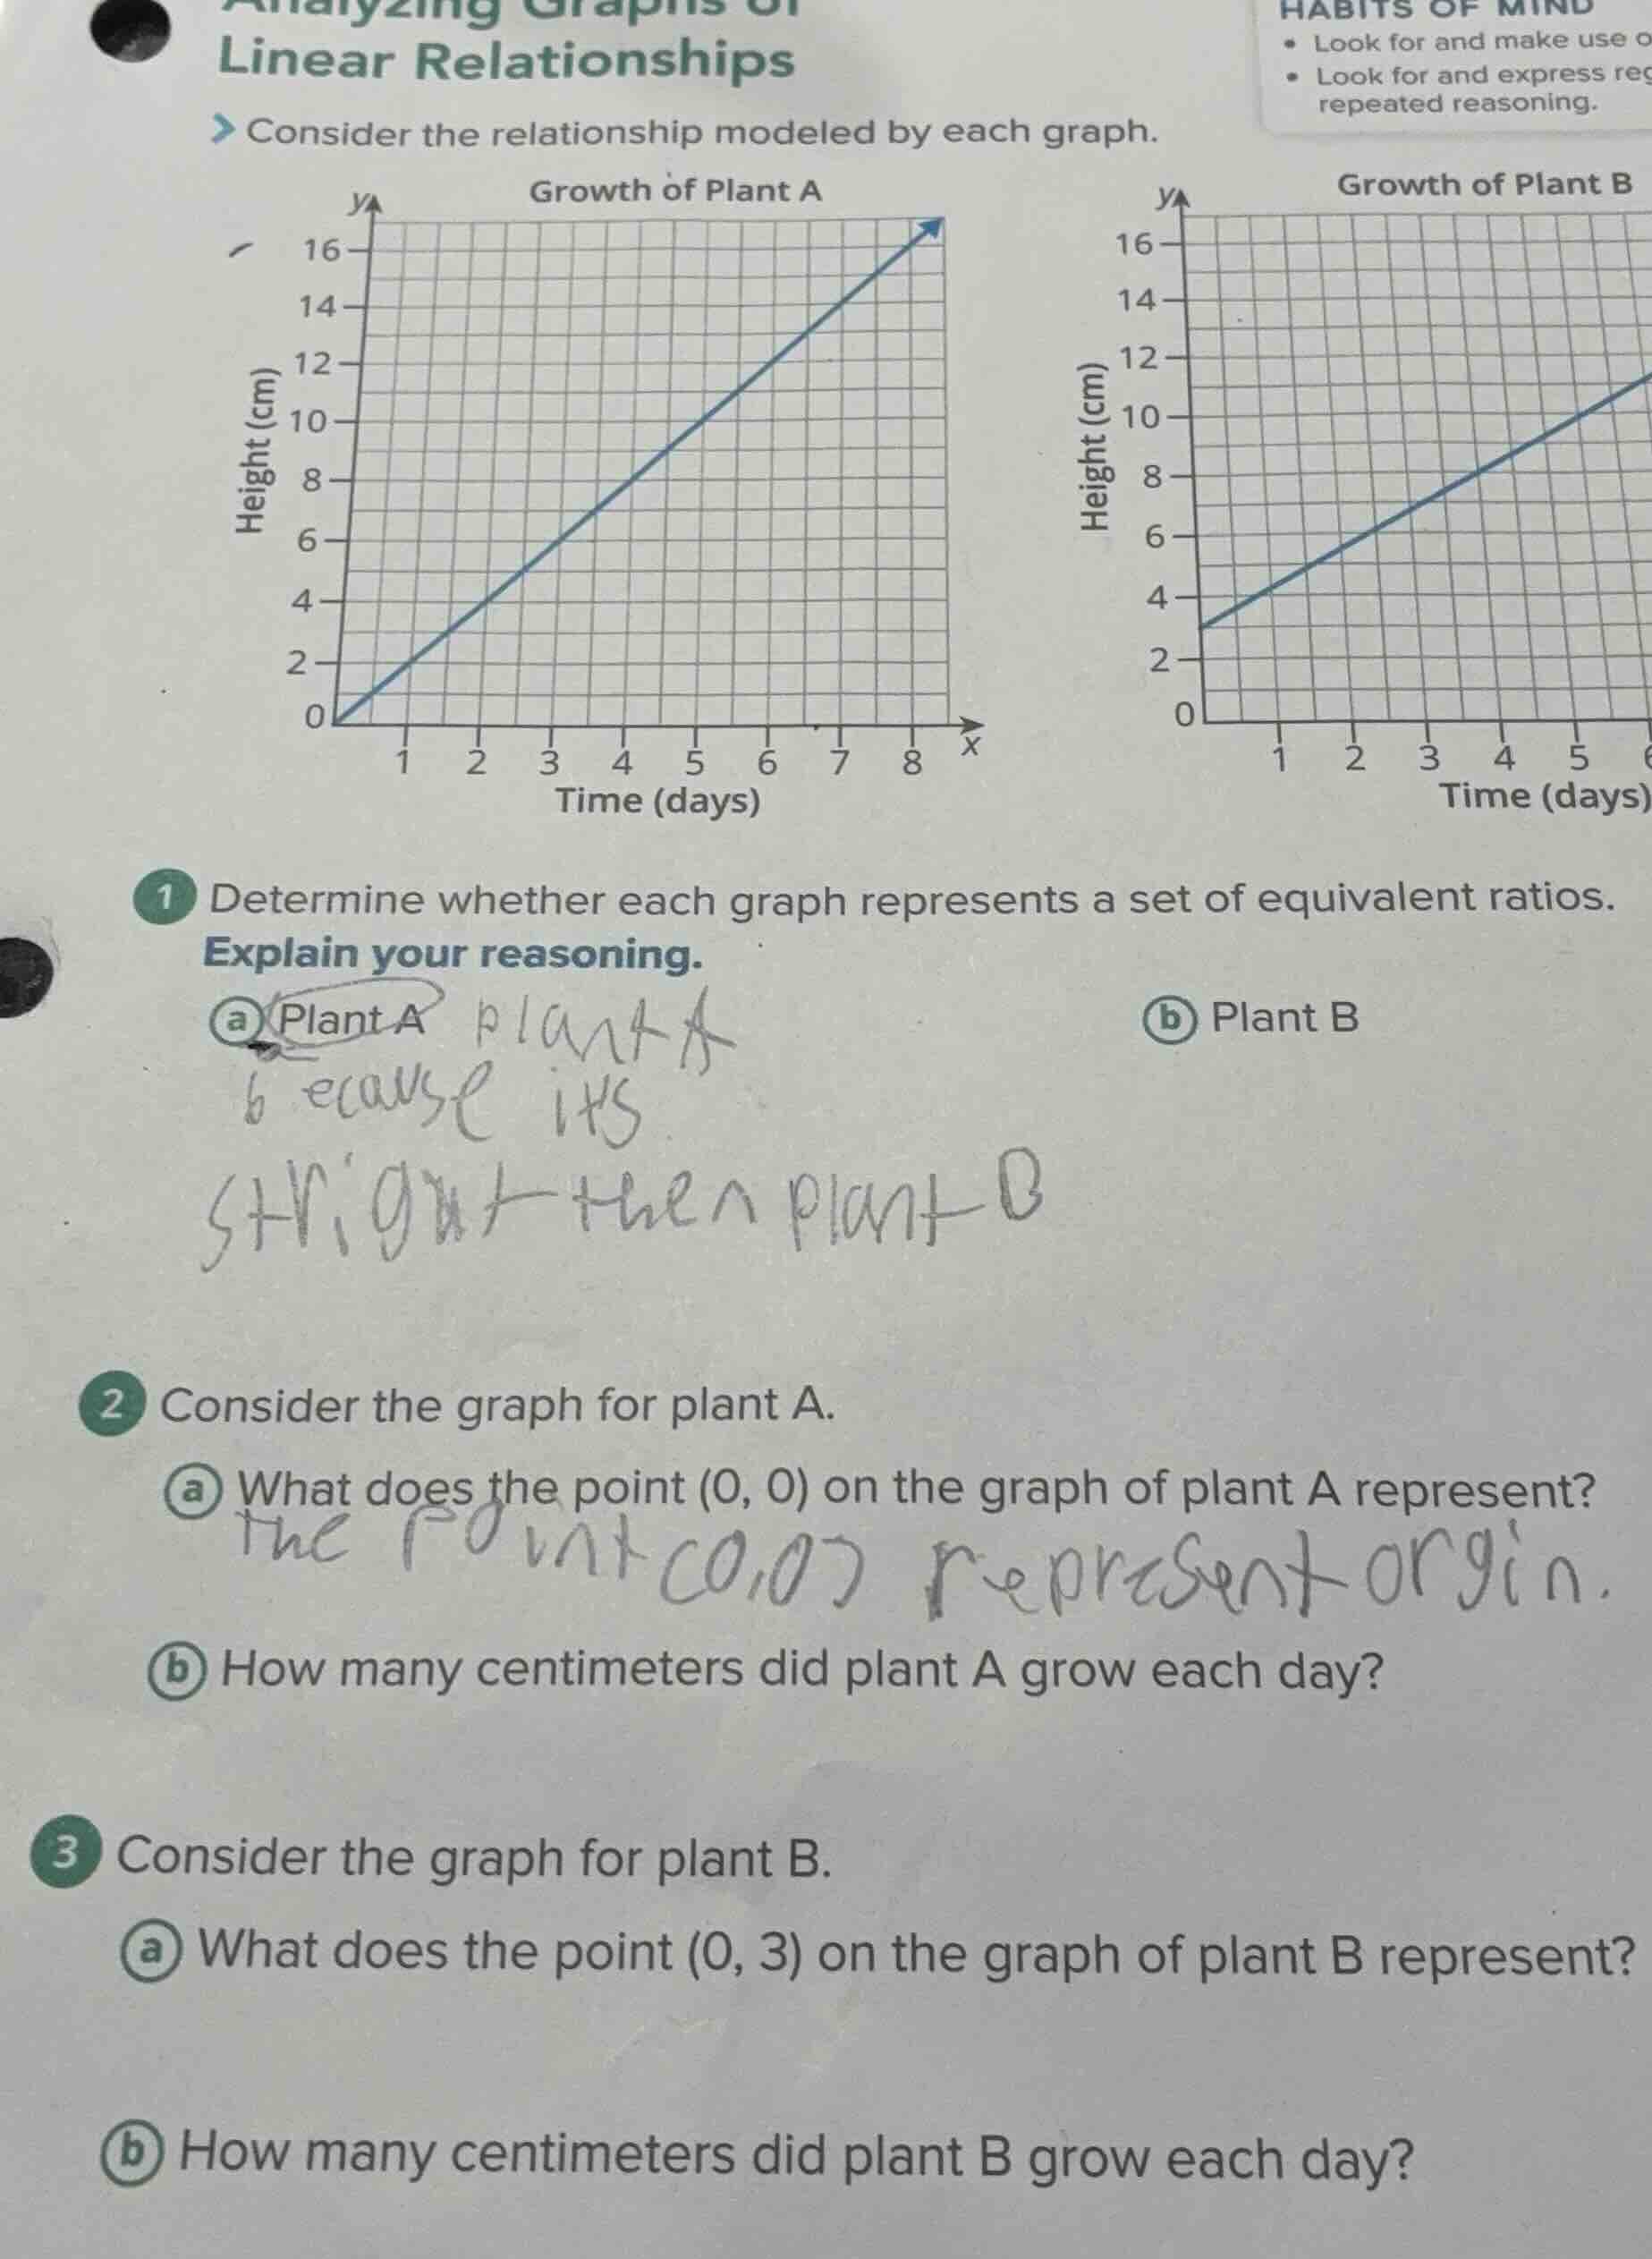
consider the relationship modeled by each graph.
growth of plant a (graph with x: time (days), y: height (cm))
growth of plant b (graph with x: time (days), y: height (cm))
1 determine whether each graph represents a set of equivalent ratios. explain your reasoning.
a plant a
b plant b
2 consider the graph for plant a.
a what does the point (0, 0) on the graph of plant a represent?
b how many centimeters did plant a grow each day?
3 consider the graph for plant b.
a what does the point (0, 3) on the graph of plant b represent?
b how many centimeters did plant b grow each day?
Problem 1a: Plant A - Equivalent Ratios
A graph represents equivalent ratios (proportional relationship) if it’s a straight line through the origin. Plant A’s graph passes through (0,0) and is linear. So, the ratio of height to time is constant (e.g., at \( x=2 \), \( y=4 \); \( \frac{4}{2}=2 \); at \( x=4 \), \( y=8 \); \( \frac{8}{4}=2 \)), so ratios are equivalent.
A proportional relationship (equivalent ratios) requires the line to pass through (0,0). Plant B’s graph starts at (0,3), not the origin. So the ratio of height to time is not constant (e.g., at \( x=0 \), \( y=3 \); \( \frac{3}{0} \) is undefined, and at \( x=2 \), \( y=6 \); \( \frac{6}{2}=3 \), but initial ratio is invalid). Thus, it does not represent equivalent ratios.
In the graph, \( x \) is time (days) and \( y \) is height (cm). At \( x=0 \) (0 days), \( y=0 \) (0 cm height). So (0,0) means at day 0, Plant A’s height is 0 cm (it starts with 0 height).

Snap & solve any problem in the app
Get step-by-step solutions on Sovi AI
Photo-based solutions with guided steps
Explore more problems and detailed explanations
Plant A’s graph represents equivalent ratios because it is a straight line passing through the origin, meaning the ratio of height to time is constant (proportional relationship).