QUESTION IMAGE
Question
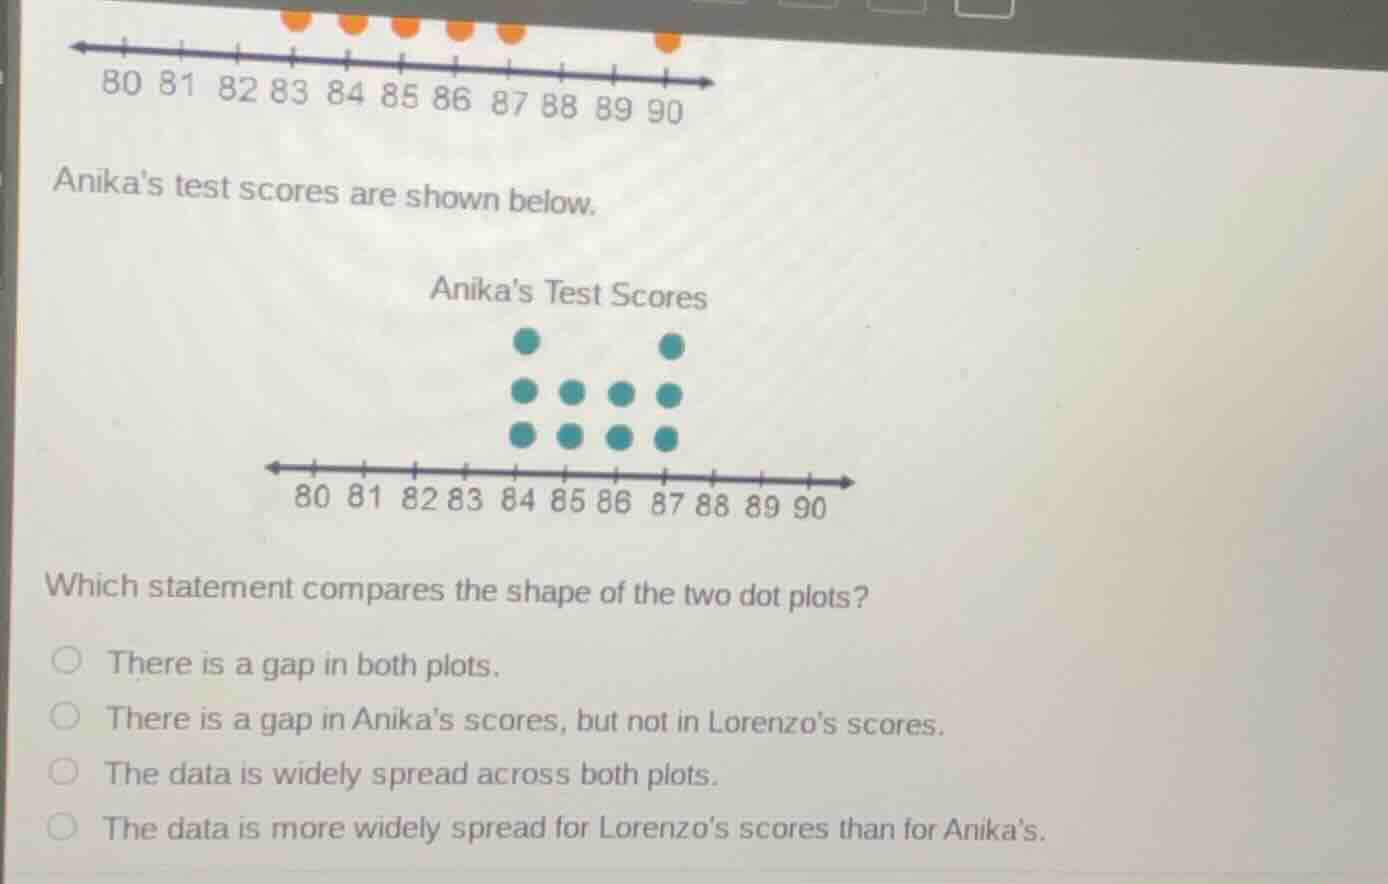
anikas test scores are shown below.
anikas test scores
which statement compares the shape of the two dot plots?
○ there is a gap in both plots.
○ there is a gap in anikas scores, but not in lorenzos scores.
○ the data is widely spread across both plots.
○ the data is more widely spread for lorenzos scores than for anikas.
Brief Explanations
- First, analyze the spread of each dot plot:
- Lorenzo's scores (top plot) range from 83 to 90, so the spread is $90 - 83 = 7$.
- Anika's scores (bottom plot) range from 84 to 88, so the spread is $88 - 84 = 4$.
- Next, check for gaps:
- Lorenzo's plot has a gap between 86 and 90.
- Anika's plot has no gaps, with scores continuous from 84 to 88.
- Evaluate each option against these observations:
- "There is a gap in both plots." → False, Anika's has no gap.
- "There is a gap in Anika's scores, but not in Lorenzo's scores." → False, reversed.
- "The data is widely spread across both plots." → False, both have narrow ranges, and Anika's is very concentrated.
- "The data is more widely spread for Lorenzo's scores than for Anika's." → True, 7 > 4, so Lorenzo's scores have a wider spread.

Snap & solve any problem in the app
Get step-by-step solutions on Sovi AI
Photo-based solutions with guided steps
Explore more problems and detailed explanations
The data is more widely spread for Lorenzo's scores than for Anika's.