QUESTION IMAGE
Question
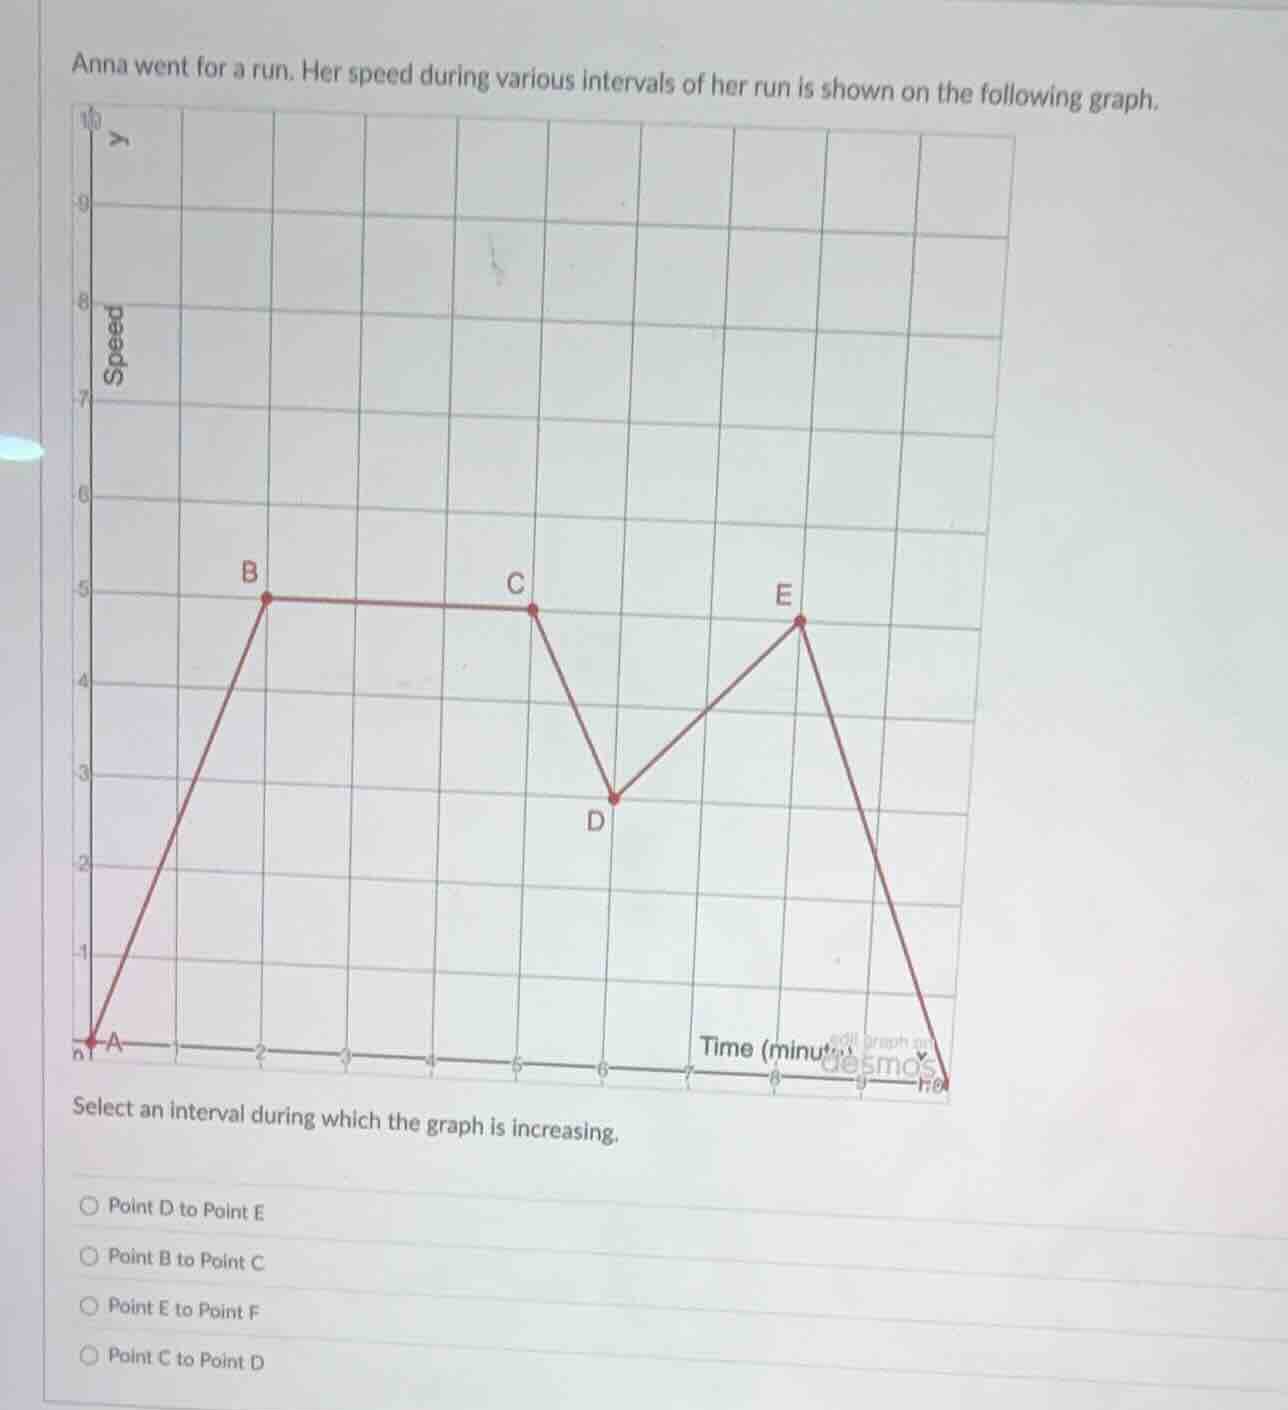
anna went for a run. her speed during various intervals of her run is shown on the following graph.
select an interval during which the graph is increasing.
- point d to point e
- point b to point c
- point e to point f
- point c to point d
Brief Explanations
An increasing graph means speed rises as time increases.
- D to E: Speed goes from 2.5 to 4.5 (increases).
- B to C: Speed stays at 5 (constant).
- E to F: Speed drops to 0 (decreases).
- C to D: Speed falls to 2.5 (decreases).
Only D to E is increasing.

Snap & solve any problem in the app
Get step-by-step solutions on Sovi AI
Photo-based solutions with guided steps
Explore more problems and detailed explanations
Point D to Point E