QUESTION IMAGE
Question
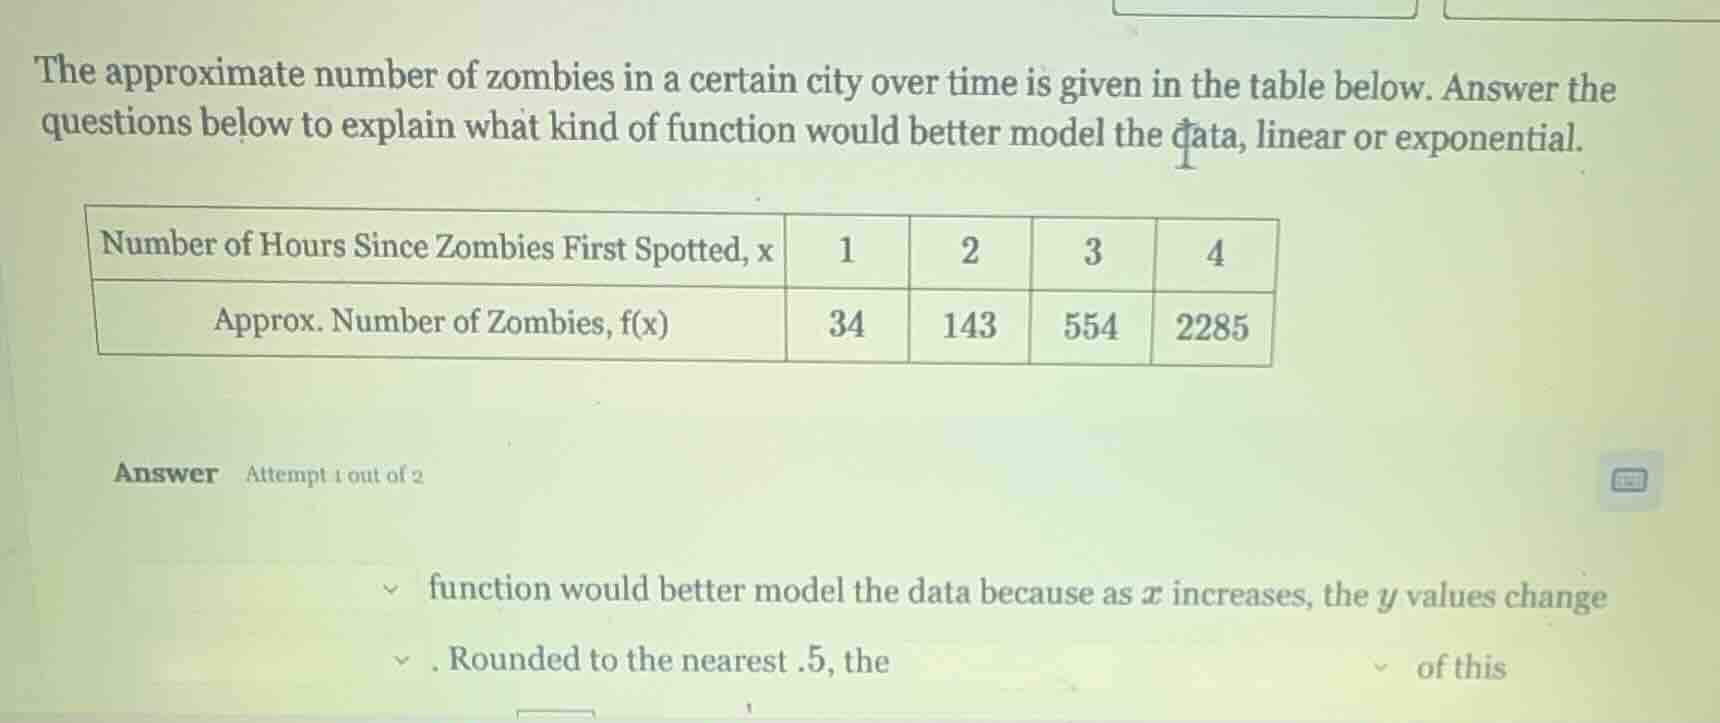
the approximate number of zombies in a certain city over time is given in the table below. answer the questions below to explain what kind of function would better model the data, linear or exponential.
| number of hours since zombies first spotted, x | 1 | 2 | 3 | 4 |
|---|
answer attempt 1 out of 2
function would better model the data because as x increases, the y values change
. rounded to the nearest.5, the of this
Step1: Check linear differences
Calculate differences between consecutive $f(x)$ values:
$143 - 34 = 109$
$554 - 143 = 411$
$2285 - 554 = 1731$
Step2: Check exponential ratios
Calculate ratios of consecutive $f(x)$ values:
$\frac{143}{34} \approx 4.21$
$\frac{554}{143} \approx 3.87$
$\frac{2285}{554} \approx 4.12$
Step3: Compare patterns
Linear models have constant differences; here differences grow rapidly. Exponential models have constant (approximate) ratios; here ratios are close to 4.0.

Snap & solve any problem in the app
Get step-by-step solutions on Sovi AI
Photo-based solutions with guided steps
Explore more problems and detailed explanations
Exponential function would better model the data because as $x$ increases, the $y$ values change by an approximately constant multiplicative factor. Rounded to the nearest .5, the common ratio of this function is 4.0.