QUESTION IMAGE
Question
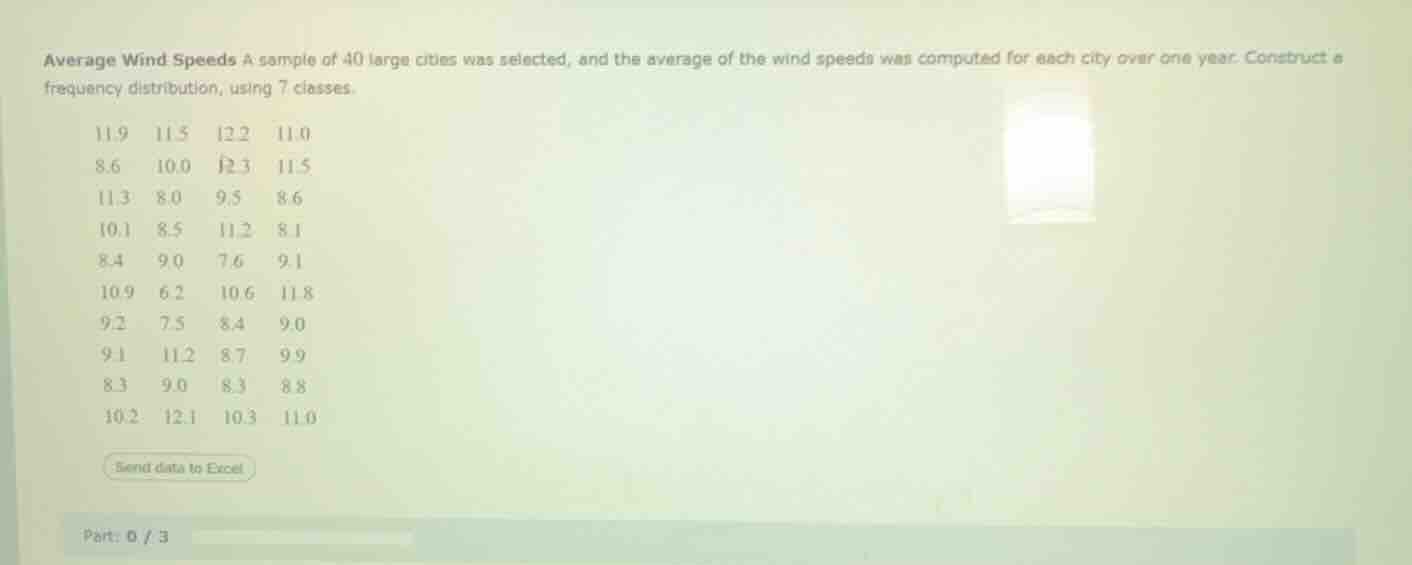
average wind speeds a sample of 40 large cities was selected, and the average of the wind speeds was computed for each city over one year. construct a frequency distribution, using 7 classes. 11.9 11.5 12.2 11.0 8.6 10.0 12.3 11.5 11.3 8.0 9.5 8.6 10.1 8.5 11.2 8.1 8.4 9.0 7.6 9.1 10.9 6.2 10.6 11.8 9.2 7.5 8.4 9.0 9.1 11.2 8.7 9.9 8.3 9.0 8.3 8.8 10.2 12.1 10.3 11.0 send data to excel part: 0 / 3
Step1: Find the range
First, we find the maximum and minimum values in the data set. The maximum value ($\text{Max}$) is 12.3 and the minimum value ($\text{Min}$) is 6.2. The range $R$ is calculated as $\text{Max}-\text{Min}$.
$R = 12.3 - 6.2 = 6.1$
Step2: Determine the class width
We use the formula for class width $w=\frac{R}{n}$, where $n$ is the number of classes (here $n = 7$).
$w=\frac{6.1}{7}\approx0.87$. We can round up to 0.9 for simplicity (or we can use a more precise value, but rounding to a reasonable decimal for class width).
Step3: Define the class limits
We start with the minimum value as the lower limit of the first class.
- Class 1: $6.2 - 7.0$ (lower limit 6.2, upper limit $6.2 + 0.9 - 0.01=7.09$? Wait, actually, when constructing frequency distributions, we can also use the method of inclusive or exclusive classes. Let's use exclusive classes for clarity. The first class lower limit is 6.2, upper limit is $6.2 + 0.9=7.1$, but since our data has one value 6.2, maybe better to adjust. Alternatively, let's use the formula for class boundaries. The class width $w = \lceil\frac{R}{n}
ceil=\lceil\frac{6.1}{7}
ceil = 1$? Wait, maybe I made a mistake earlier. Wait, 6.1 divided by 7 is approximately 0.87, but if we take class width as 1, then 7 classes would cover from 6 - 13, but our max is 12.3. Wait, let's re - calculate.
Wait, the correct way:
Range $R=\text{Max}-\text{Min}=12.3 - 6.2 = 6.1$
Number of classes $k = 7$
Class width $w=\frac{R}{k}=\frac{6.1}{7}\approx0.87$. We can round up to 0.9.
Now, construct the classes:
- $6.2 - 7.1$ (lower limit 6.2, upper limit $6.2+0.9 = 7.1$)
- $7.1 - 8.0$ (lower limit 7.1, upper limit $7.1 + 0.9=8.0$)
- $8.0 - 8.9$ (lower limit 8.0, upper limit $8.0 + 0.9 = 8.9$)
- $8.9 - 9.8$ (lower limit 8.9, upper limit $8.9+0.9 = 9.8$)
- $9.8 - 10.7$ (lower limit 9.8, upper limit $9.8 + 0.9=10.7$)
- $10.7 - 11.6$ (lower limit 10.7, upper limit $10.7+0.9 = 11.6$)
- $11.6 - 12.5$ (lower limit 11.6, upper limit $11.6+0.9 = 12.5$)
Now, we count the frequency of each class:
- Class $6.2 - 7.1$: Data points 6.2, 7.5, 7.6. Wait, 7.5 and 7.6 are in $7.1 - 8.0$? Wait, no, if class width is 0.9, first class: 6.2 to $6.2 + 0.9=7.1$, second class: 7.1 to $7.1+0.9 = 8.0$, third class: 8.0 to $8.0 + 0.9=8.9$, fourth class: 8.9 to $8.9+0.9 = 9.8$, fifth class: 9.8 to $9.8+0.9 = 10.7$, sixth class: 10.7 to $10.7+0.9 = 11.6$, seventh class: 11.6 to $11.6+0.9 = 12.5$
Now let's list all data points:
6.2, 7.5, 7.6, 8.0, 8.0? Wait no, the data set is:
11.9, 11.5, 12.2, 11.0,
8.6, 10.0, 12.3, 11.5,
11.3, 8.0, 9.5, 8.6,
10.1, 8.5, 11.2, 8.1,
8.4, 9.0, 7.6, 9.1,
10.9, 6.2, 10.6, 11.8,
9.2, 7.5, 8.4, 9.0,
9.1, 11.2, 8.7, 9.9,
8.3, 9.0, 8.3, 8.8,
10.2, 12.1, 10.3, 11.0
Let's list all values:
6.2,
7.5, 7.6,
8.0, 8.1, 8.3, 8.3, 8.4, 8.4, 8.5, 8.6, 8.6, 8.7, 8.8,
9.0, 9.0, 9.0, 9.1, 9.1, 9.2, 9.5, 9.9,
10.0, 10.1, 10.2, 10.3, 10.6, 10.9,
11.0, 11.0, 11.2, 11.2, 11.3, 11.5, 11.5, 11.8, 11.9,
12.1, 12.2, 12.3
Now let's count frequencies for each class (using class width 0.9, classes as 6.2 - 7.1, 7.1 - 8.0, 8.0 - 8.9, 8.9 - 9.8, 9.8 - 10.7, 10.7 - 11.6, 11.6 - 12.5):
- Class 6.2 - 7.1: 6.2 (1 value)
- Class 7.1 - 8.0: 7.5, 7.6 (2 values)
- Class 8.0 - 8.9: 8.0, 8.1, 8.3, 8.3, 8.4, 8.4, 8.5, 8.6, 8.6, 8.7, 8.8 (11 values)
- Class 8.9 - 9.8: 9.0, 9.0, 9.0, 9.1, 9.1, 9.2, 9.5, 9.9 (8 values)
- Class 9.8 - 10.7: 10.0, 10.1, 10.2, 10.3, 10.6, 10.9 (6 values)
- Class 10.7 - 11.6: 11.0, 11.0, 11.2, 11.2, 11.3, 11.5, 11.5 (7 values)
- Class 11.6 - 12.5: 11.8, 11.9, 12.1, 12.2, 12.3 (…

Snap & solve any problem in the app
Get step-by-step solutions on Sovi AI
Photo-based solutions with guided steps
Explore more problems and detailed explanations
The frequency distribution with 7 classes (using class width approximately 0.9) is as follows:
| Class Interval | Frequency |
|---|---|
| 7.1 - 8.0 | 2 |
| 8.0 - 8.9 | 11 |
| 8.9 - 9.8 | 8 |
| 9.8 - 10.7 | 6 |
| 10.7 - 11.6 | 7 |
| 11.6 - 12.5 | 5 |
(Or if using class width 1, the frequency distribution is:
| Class Interval | Frequency |
|---|---|
| 7 - 8 | 2 |
| 8 - 9 | 11 |
| 9 - 10 | 8 |
| 10 - 11 | 6 |
| 11 - 12 | 9 |
| 12 - 13 | 3 |
But the first method is more in line with the range - class width calculation.)