QUESTION IMAGE
Question
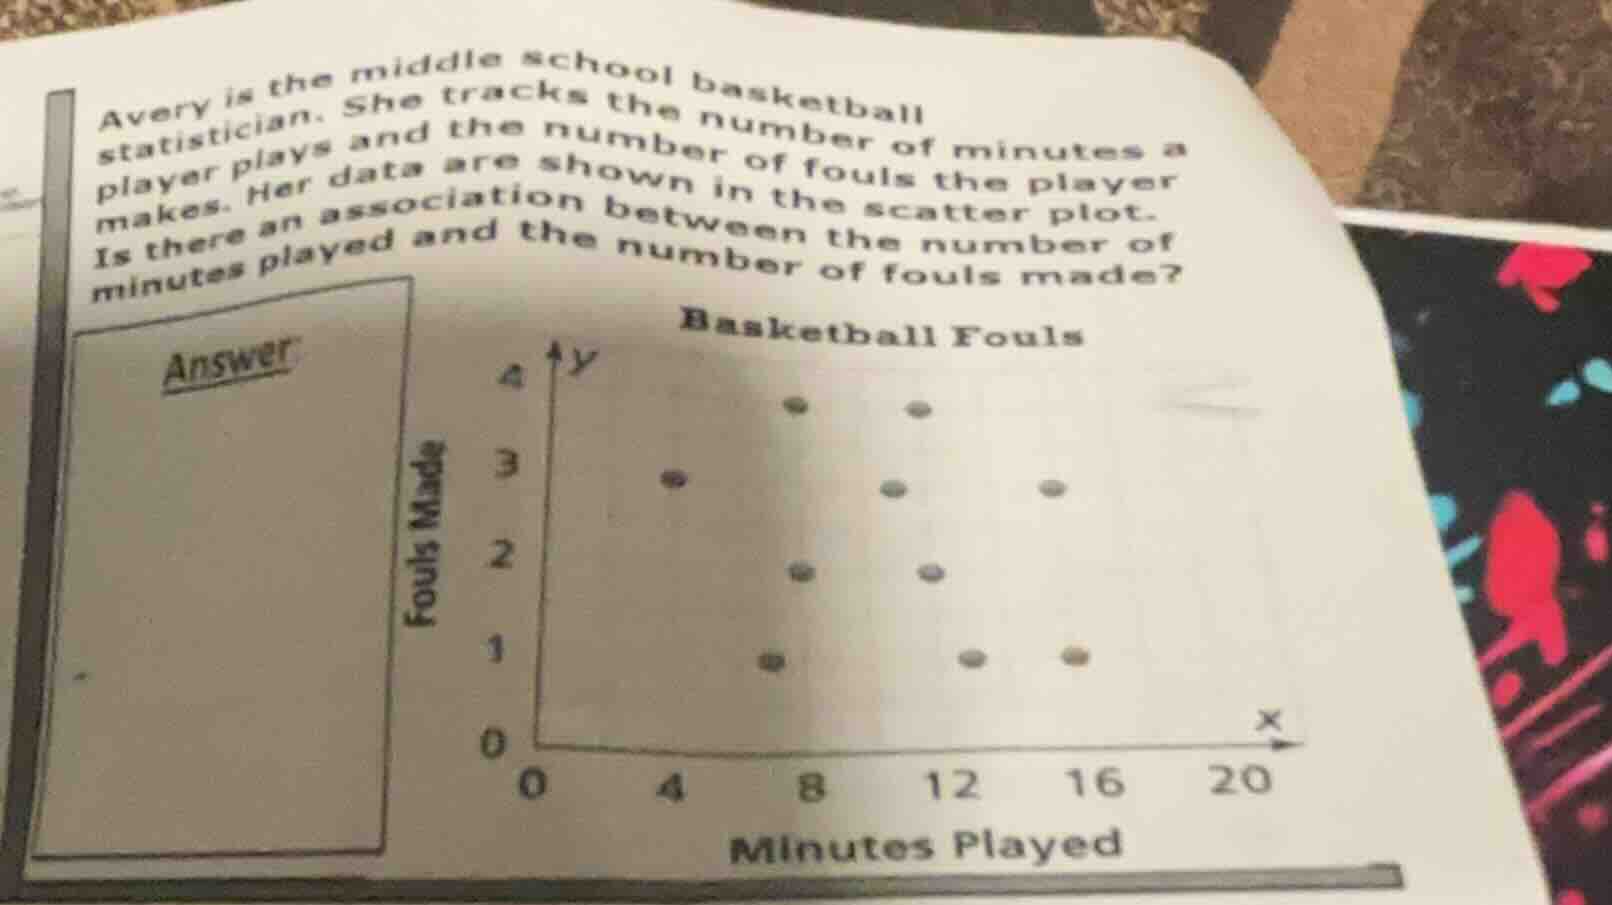
avery is the middle school basketball statistician. she tracks the number of minutes a player plays and the number of fouls the player makes. her data are shown in the scatter plot. is there an association between the number of minutes played and the number of fouls made? basketball fouls, x:minutes played, y:fouls made
Step1: Analyze the scatter plot trend
To determine if there's an association, we look at the general trend of the points. As the \( x \)-value (minutes played) increases, we observe the \( y \)-values (fouls made). The points seem to show a pattern where as minutes played increase, the number of fouls made also tends to increase (or at least there's a positive trend, with points generally moving up as \( x \) increases).
Step2: Determine the association
Since the scatter plot shows a positive trend (as minutes played increase, fouls made tend to increase), there is an association (a positive association) between the number of minutes played and the number of fouls made.

Snap & solve any problem in the app
Get step-by-step solutions on Sovi AI
Photo-based solutions with guided steps
Explore more problems and detailed explanations
Yes, there is an association (a positive association) between the number of minutes played and the number of fouls made. As the number of minutes a player plays increases, the number of fouls the player makes tends to increase (the points in the scatter plot show a general upward trend as minutes played increase).