QUESTION IMAGE
Question
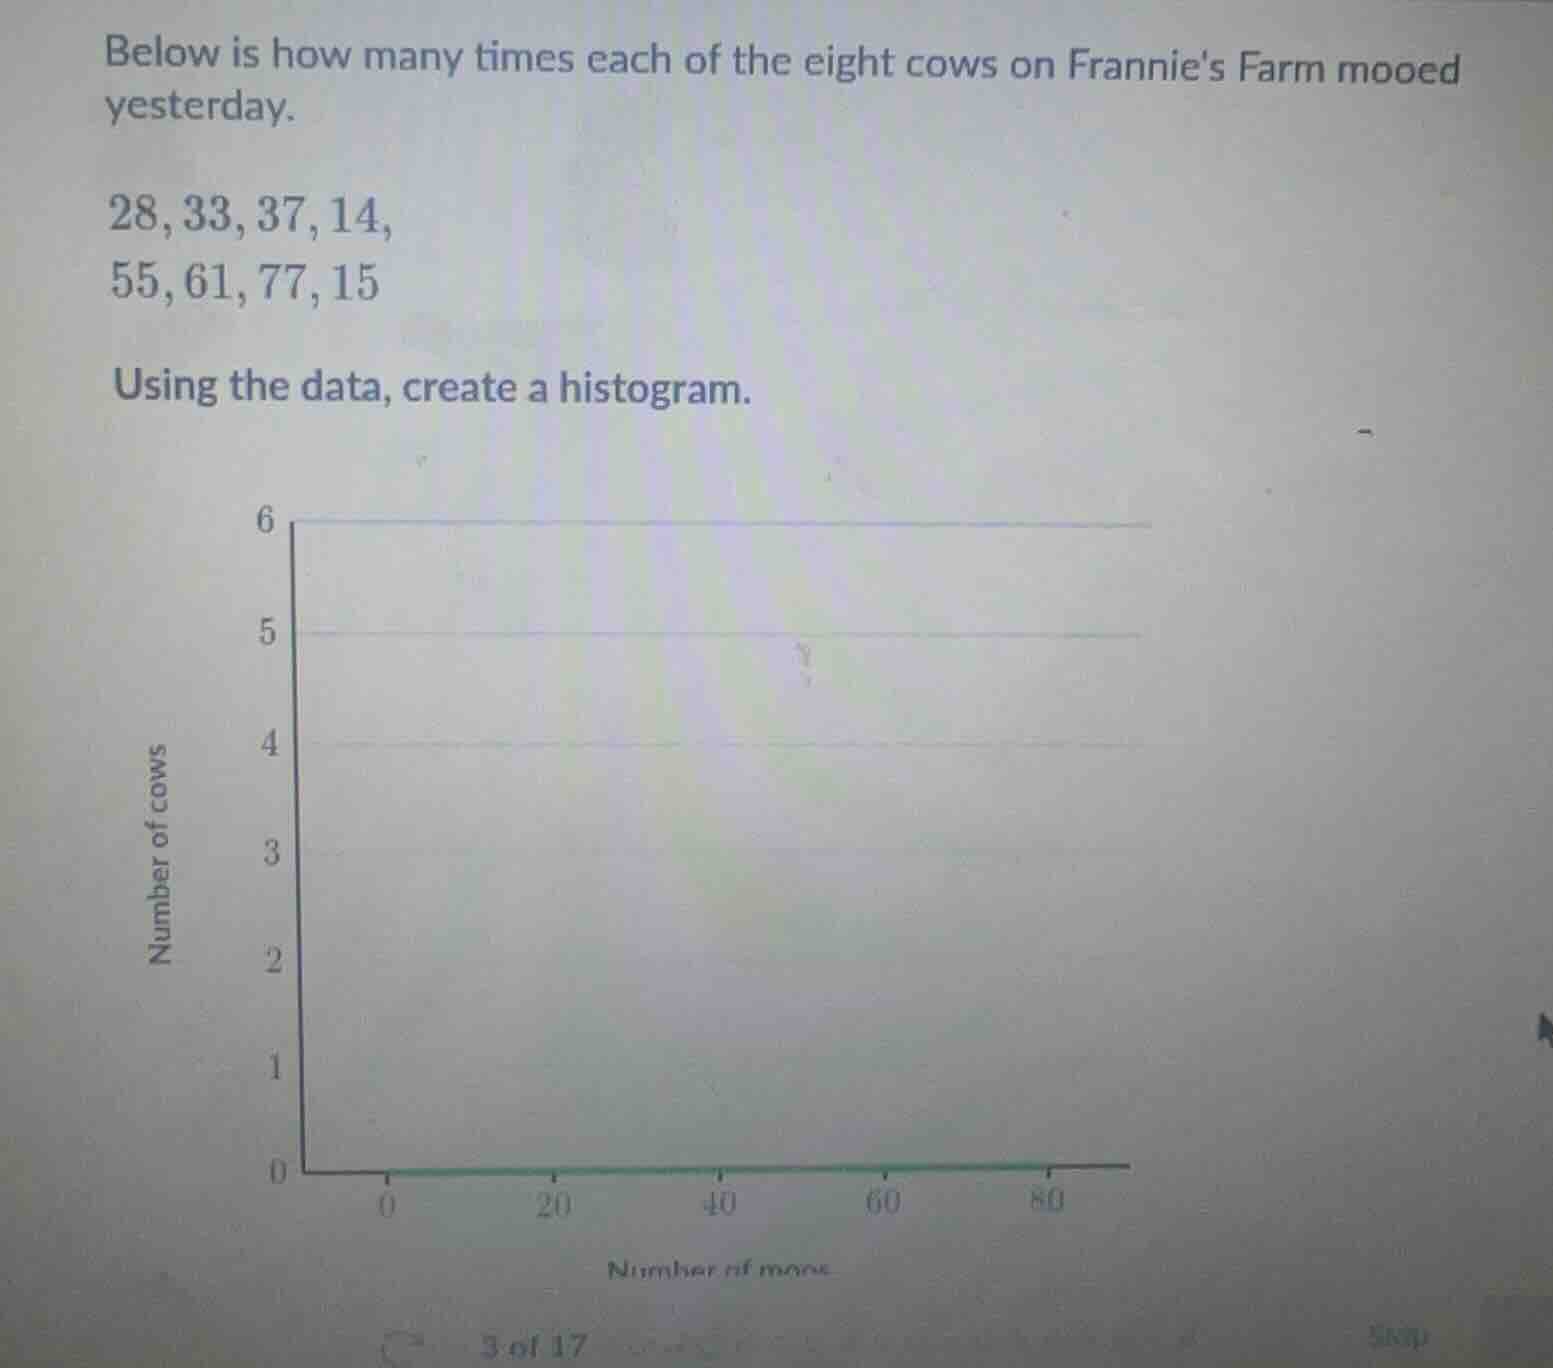
below is how many times each of the eight cows on frannies farm mooed yesterday.
28, 33, 37, 14,
55, 61, 77, 15
using the data, create a histogram.
(there is a coordinate system with the vertical axis labeled number of cows and the horizontal axis labeled number of moos with scale marks at 0, 20, 40, 60, 80)
Step1: Determine the range and intervals
First, find the minimum and maximum values in the data set. The data is \(28, 33, 37, 14, 55, 61, 77, 15\). The minimum value is \(14\) and the maximum is \(77\). We can choose intervals (bins) of width \(20\) for simplicity: \(0 - 20\), \(20 - 40\), \(40 - 60\), \(60 - 80\).
Step2: Count the frequency in each interval
- For the interval \(0 - 20\): The values \(14, 15\) fall here. So frequency \(= 2\).
- For the interval \(20 - 40\): The values \(28, 33, 37\) fall here. So frequency \(= 3\).
- For the interval \(40 - 60\): The value \(55\) falls here. So frequency \(= 1\).
- For the interval \(60 - 80\): The values \(61, 77\) fall here. So frequency \(= 2\).
Step3: Draw the histogram
On the x - axis, mark the intervals \(0 - 20\), \(20 - 40\), \(40 - 60\), \(60 - 80\). On the y - axis, mark the number of cows (frequency). For each interval, draw a bar whose height is equal to the frequency of that interval.
- For \(0 - 20\): Draw a bar with height \(2\).
- For \(20 - 40\): Draw a bar with height \(3\).
- For \(40 - 60\): Draw a bar with height \(1\).
- For \(60 - 80\): Draw a bar with height \(2\).
To represent this as a text - based histogram (approximate):
| Number of moos | Number of cows | |||
|---|---|---|---|---|
| \(20 - 40\) | ||||
| \(40 - 60\) | ||||
| \(60 - 80\) |
(In a proper graphical histogram, the bars are adjacent rectangles with heights corresponding to the frequencies calculated above.)

Snap & solve any problem in the app
Get step-by-step solutions on Sovi AI
Photo-based solutions with guided steps
Explore more problems and detailed explanations
The histogram is constructed with intervals \(0 - 20\) (frequency \(2\)), \(20 - 40\) (frequency \(3\)), \(40 - 60\) (frequency \(1\)), \(60 - 80\) (frequency \(2\)) and bars of corresponding heights for each interval.