QUESTION IMAGE
Question
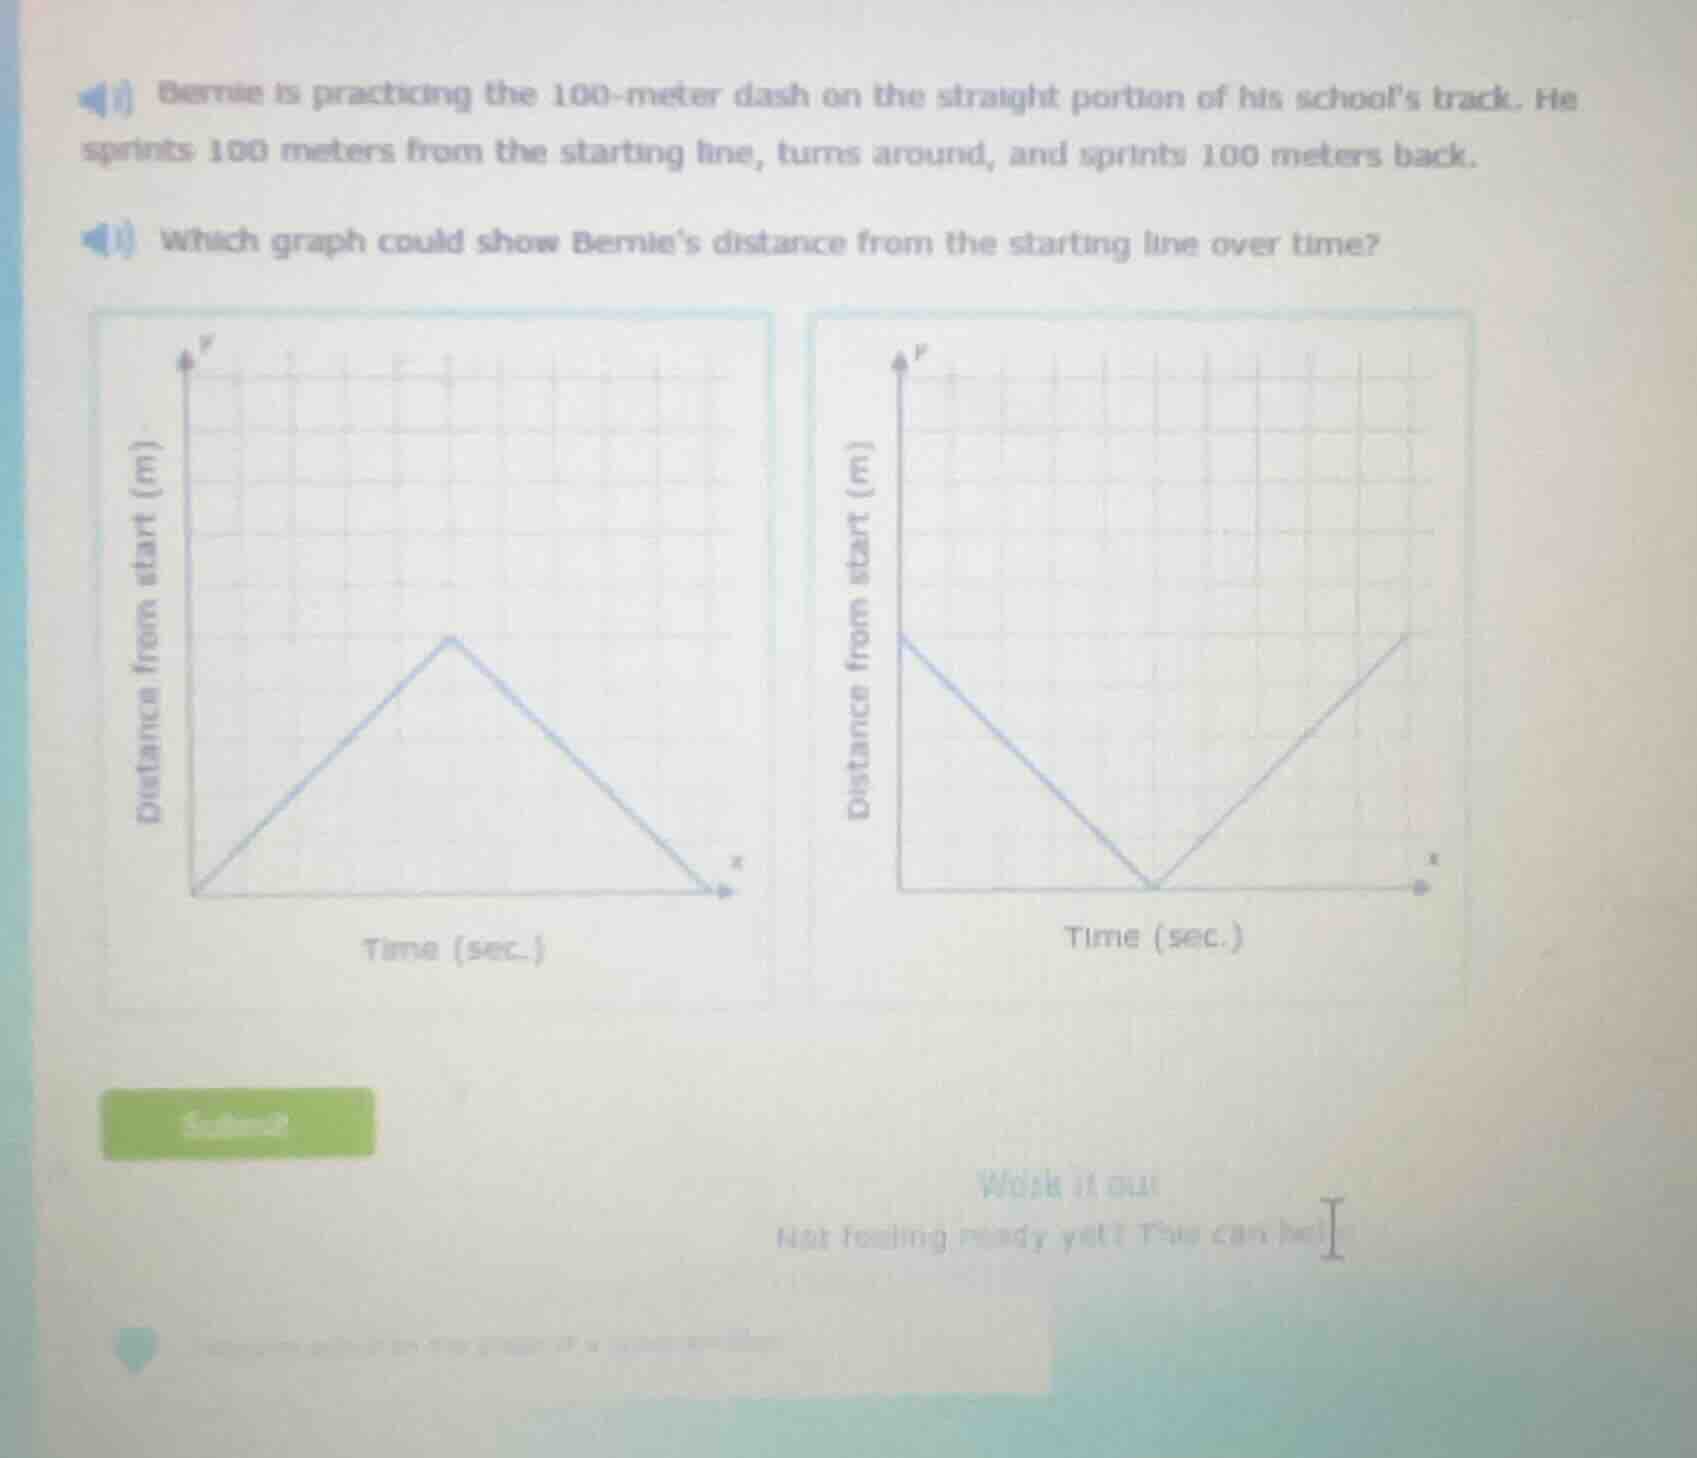
bernie is practicing the 100 - meter dash on the straight portion of his school’s track. he sprints 100 meters from the starting line, turns around, and sprints 100 meters back. which graph could show bernie’s distance from the starting line over time?
Bernie starts at the starting line (distance = 0 m). As he sprints 100 meters away, his distance from the start increases over time. When he turns around and sprints back, his distance from the start decreases over time until he returns to 0 m. This matches the first graph's shape.

Snap & solve any problem in the app
Get step-by-step solutions on Sovi AI
Photo-based solutions with guided steps
Explore more problems and detailed explanations
The left graph (starting at 0, rising to a peak, then falling back to 0 on the time axis)