QUESTION IMAGE
Question
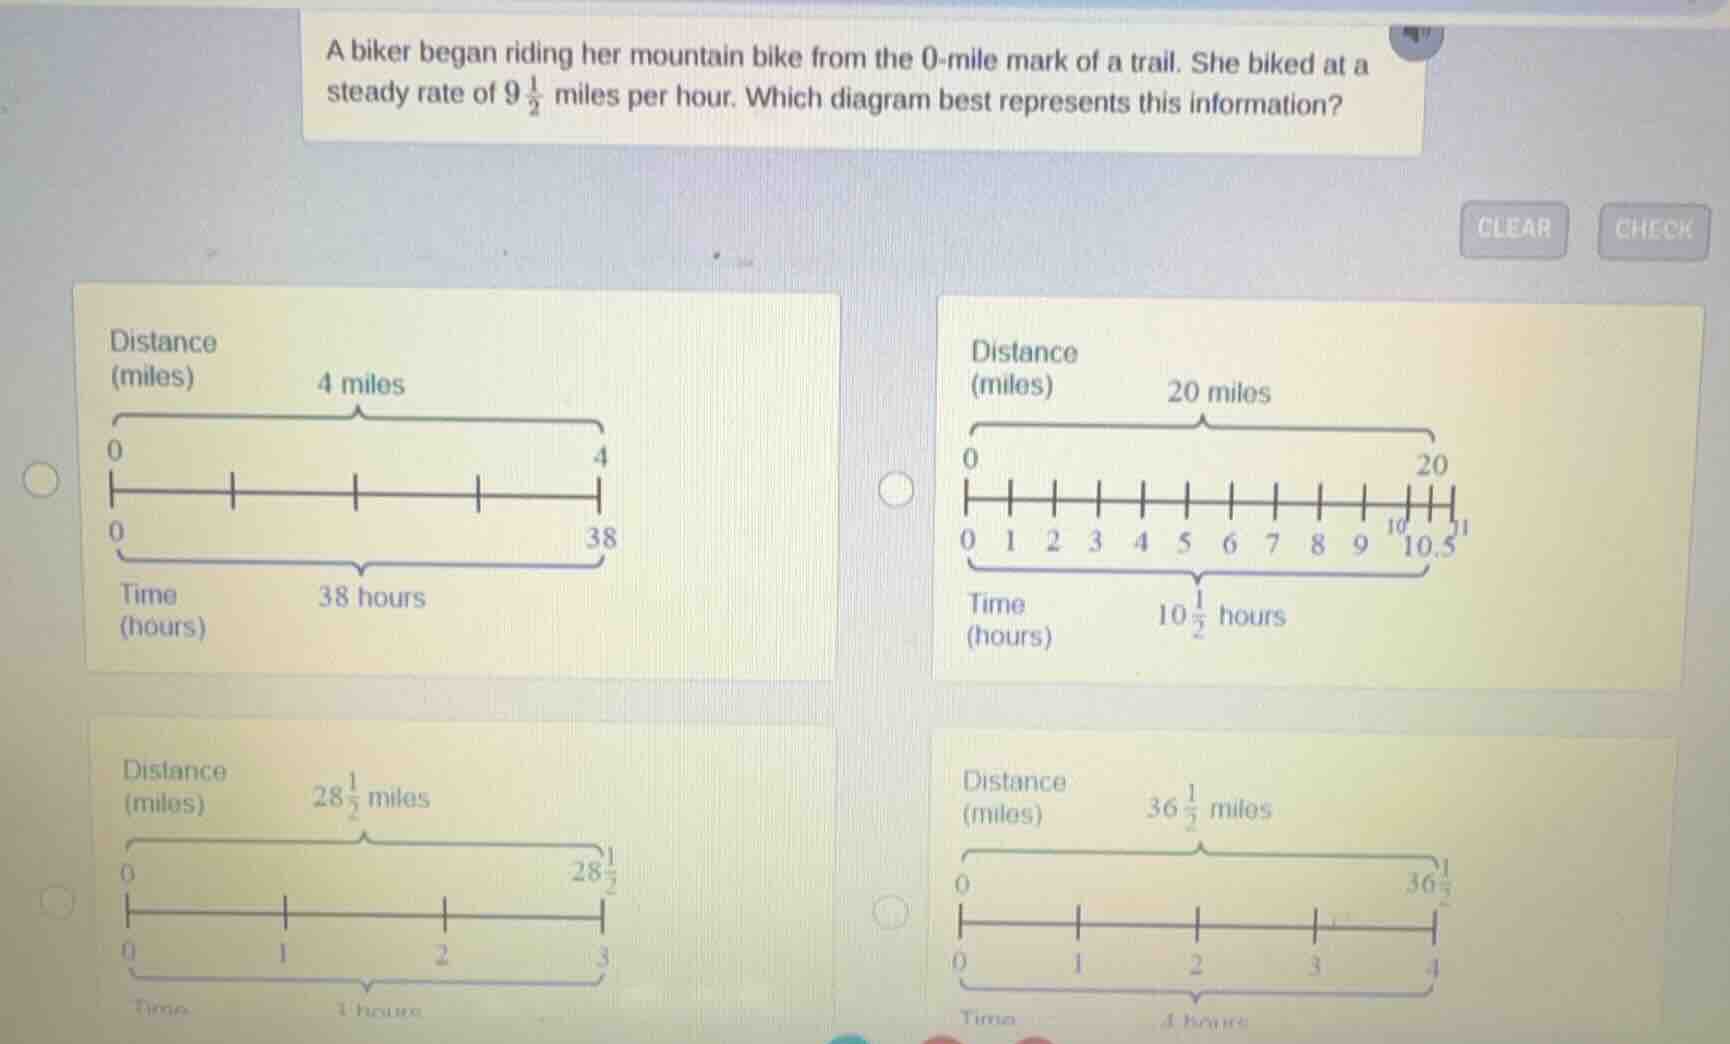
a biker began riding her mountain bike from the 0 - mile mark of a trail. she biked at a steady rate of $9\frac{1}{2}$ miles per hour. which diagram best represents this information?
Step1: Recall speed-distance formula
The relationship between distance $d$, speed $r$, and time $t$ is $d = r \times t$. Here, $r = 9\frac{1}{2} = \frac{19}{2}$ miles per hour.
Step2: Test each diagram's rate
For top-left diagram:
Rate = $\frac{\text{Total Distance}}{\text{Total Time}} = \frac{4}{38} = \frac{2}{19}$ miles/hour (does not match)
For top-right diagram:
Rate = $\frac{20}{10.5} = \frac{20}{\frac{21}{2}} = \frac{40}{21} \approx 1.90$ miles/hour (does not match)
For bottom-left diagram:
Rate = $\frac{28.5}{3} = 9.5 = 9\frac{1}{2}$ miles/hour (matches)
For bottom-right diagram:
Rate = $\frac{36.5}{4} = 9.125$ miles/hour (does not match)

Snap & solve any problem in the app
Get step-by-step solutions on Sovi AI
Photo-based solutions with guided steps
Explore more problems and detailed explanations
The bottom-left diagram (with 28$\frac{1}{2}$ miles over 3 hours) best represents the information.