QUESTION IMAGE
Question
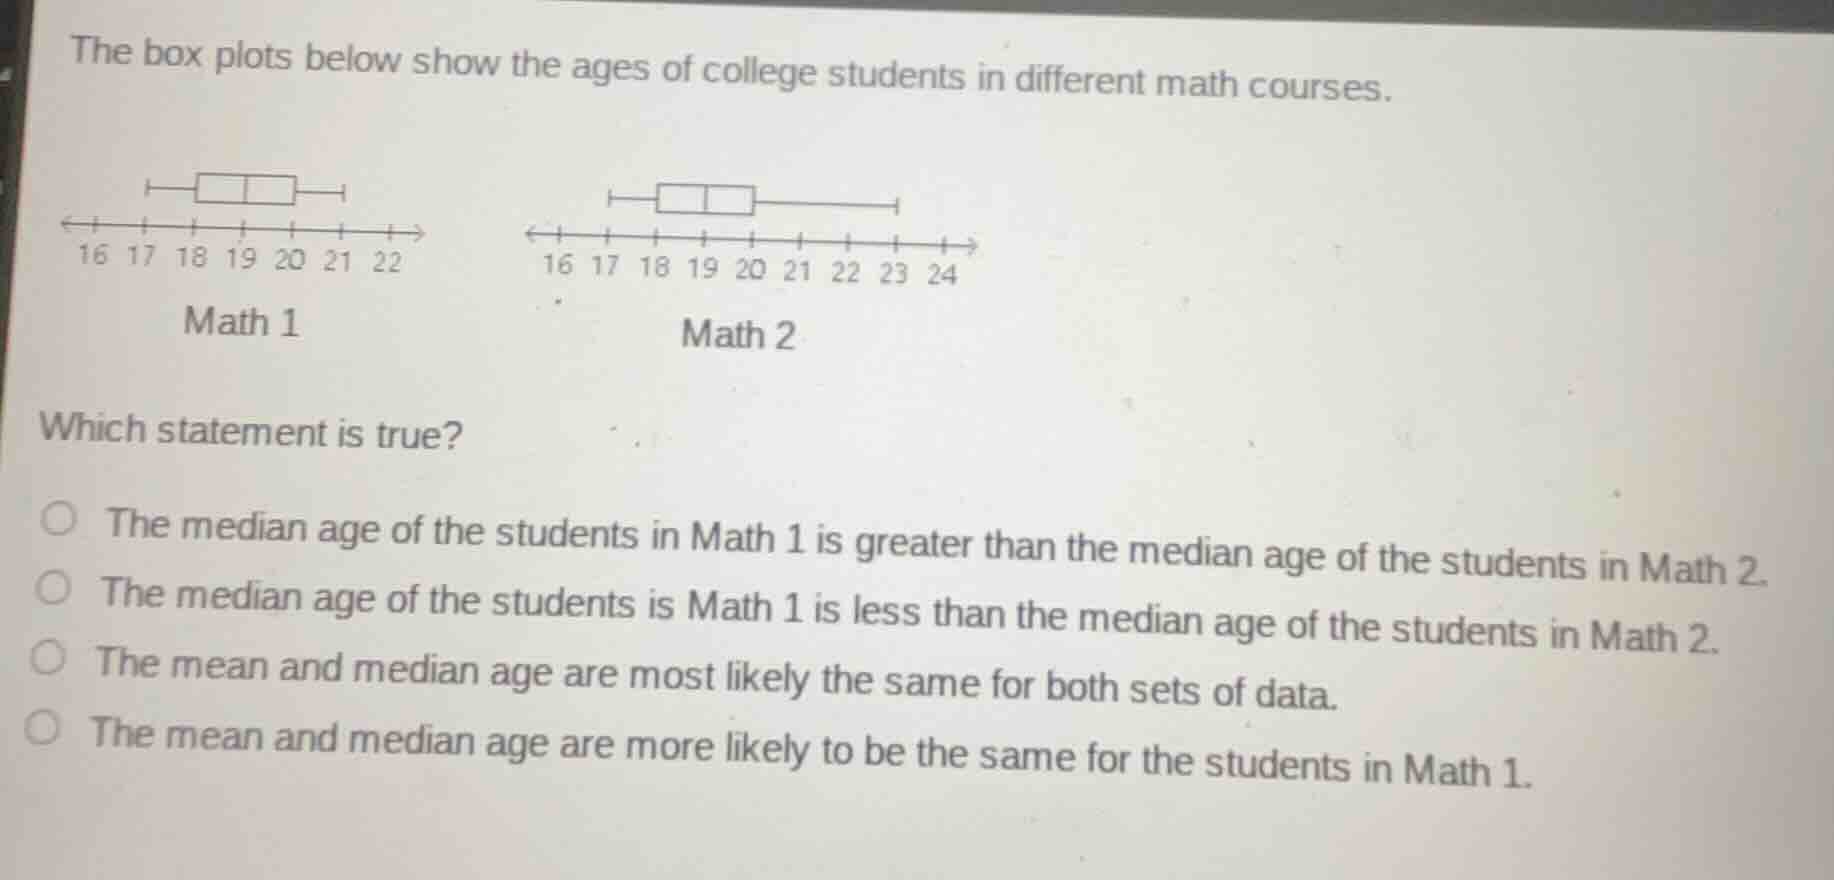
the box plots below show the ages of college students in different math courses.
math 1
math 2
which statement is true?
the median age of the students in math 1 is greater than the median age of the students in math 2.
the median age of the students is math 1 is less than the median age of the students in math 2.
the mean and median age are most likely the same for both sets of data.
the mean and median age are more likely to be the same for the students in math 1.
Step1: Identify medians from boxplots
For Math 1: The median (line inside box) is 19.
For Math 2: The median (line inside box) is 19.
Step2: Assess symmetry of data
Math 1 boxplot: Whiskers and box are symmetric, so data is roughly symmetric (mean ≈ median).
Math 2 boxplot: Right whisker is much longer, so data is right-skewed (mean > median).
Step3: Evaluate each option
- Option1: Math1 median > Math2 median? 19 ≯ 19 → False.
- Option2: Math1 median < Math2 median? 19 ≮ 19 → False.
- Option3: Mean=median for both? Math2 is skewed → False.
- Option4: Mean=median more likely for Math1? Math1 is symmetric → True.

Snap & solve any problem in the app
Get step-by-step solutions on Sovi AI
Photo-based solutions with guided steps
Explore more problems and detailed explanations
The mean and median age are more likely to be the same for the students in Math 1.