QUESTION IMAGE
Question
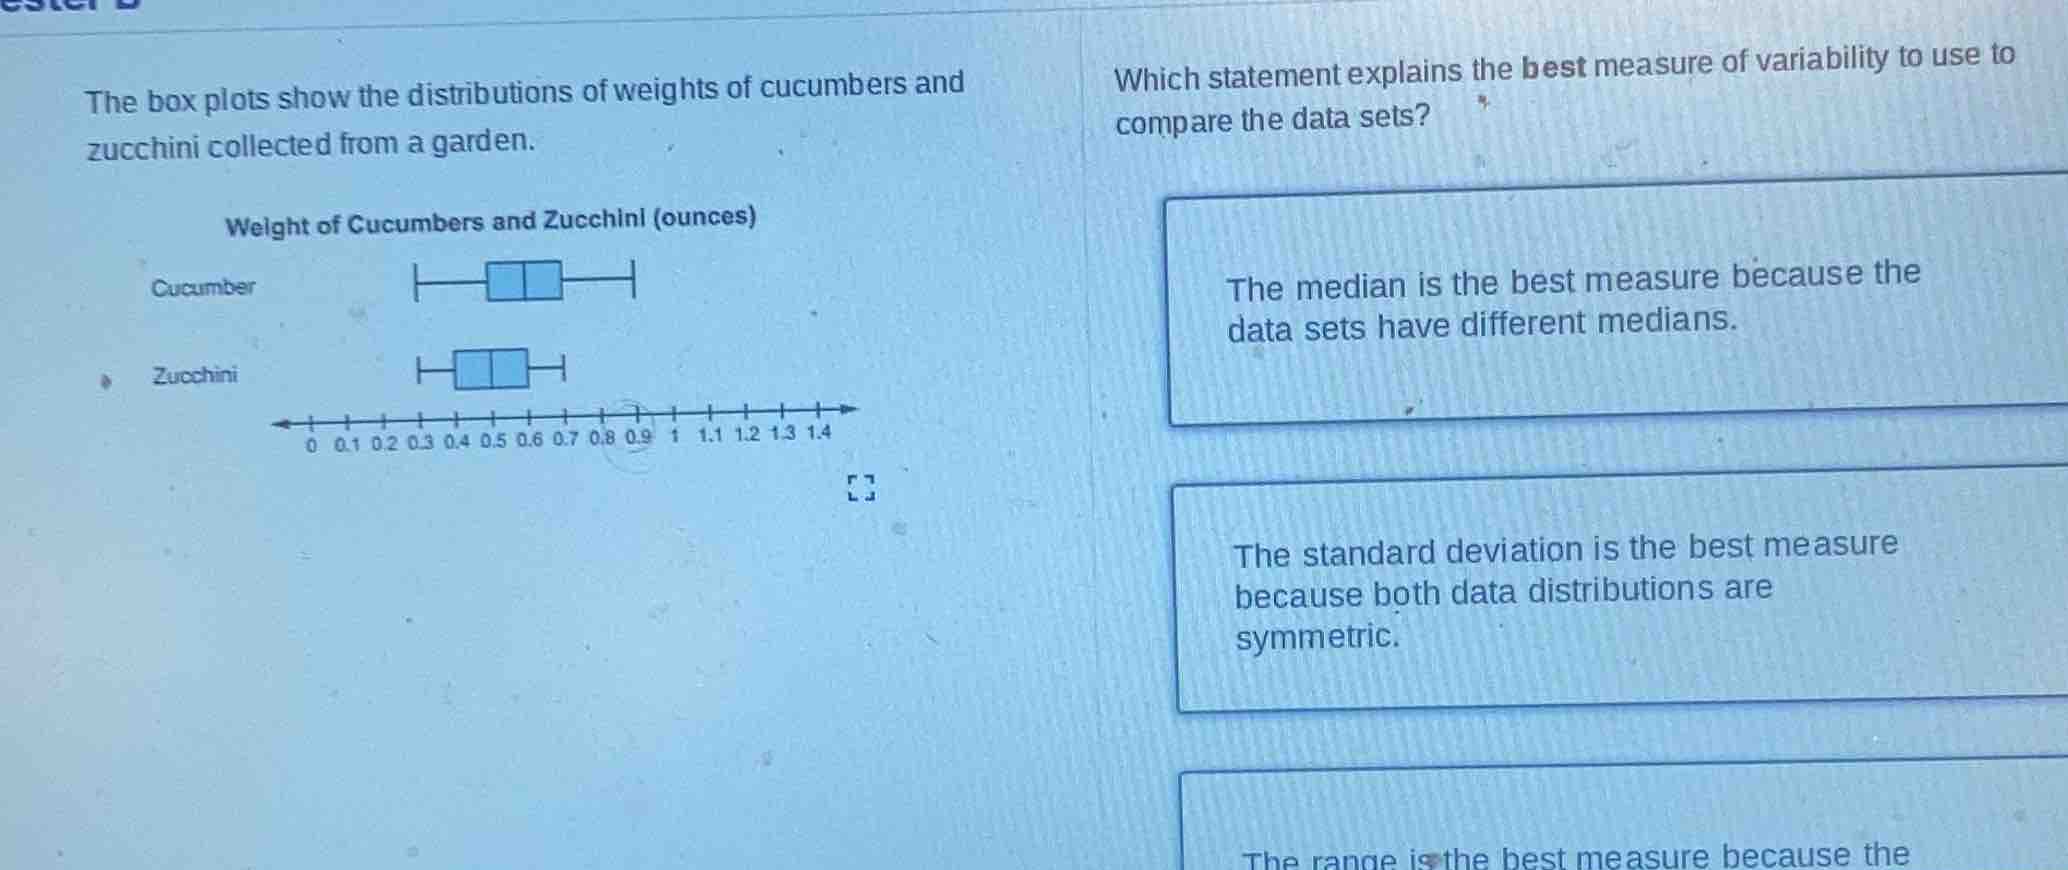
the box plots show the distributions of weights of cucumbers and zucchini collected from a garden. weight of cucumbers and zucchini (ounces) cucumber zucchini 0 0.1 0.2 0.3 0.4 0.5 0.6 0.7 0.8 0.9 1 1.1 1.2 1.3 1.4 which statement explains the best measure of variability to use to compare the data sets? the median is the best measure because the data sets have different medians. the standard deviation is the best measure because both data distributions are symmetric. the range is the best measure because the
To solve this, we analyze each option:
- Option about median: Median measures central tendency, not variability. So this is incorrect.
- Option about standard deviation: For symmetric distributions, standard deviation (a measure of variability) is appropriate as it uses all data points and is good for symmetric data. The box - plots (with symmetric box and whisker shapes) suggest symmetric distributions.
- Option about range (partially shown): Range only uses max and min, ignoring most data. It’s not as good as standard deviation for symmetric, continuous data like weights.

Snap & solve any problem in the app
Get step-by-step solutions on Sovi AI
Photo-based solutions with guided steps
Explore more problems and detailed explanations
The standard deviation is the best measure because both data distributions are symmetric.