QUESTION IMAGE
Question
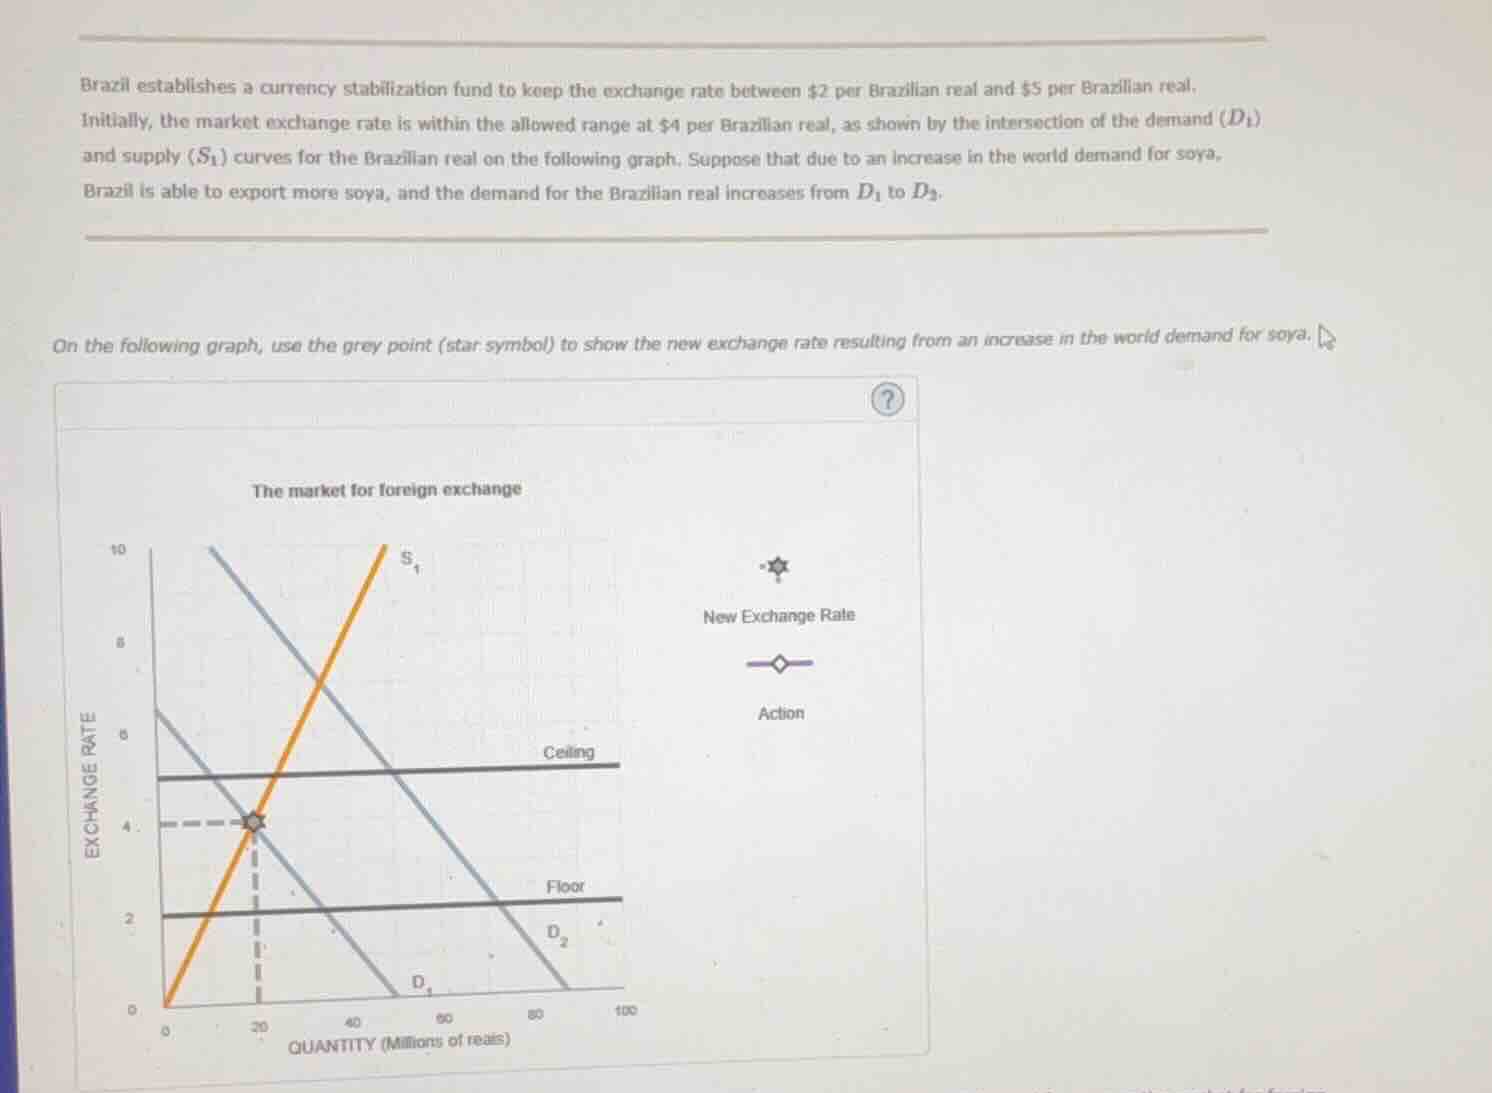
brazil establishes a currency stabilization fund to keep the exchange rate between $2 per brazilian real and $5 per brazilian real. initially, the market exchange rate is within the allowed range at $4 per brazilian real, as shown by the intersection of the demand (d₁) and supply (s₁) curves for the brazilian real on the following graph. suppose that due to an increase in the world demand for soya, brazil is able to export more soya, and the demand for the brazilian real increases from d₁ to d₂. on the following graph, use the grey point (star symbol) to show the new exchange rate resulting from an increase in the world demand for soya.
Step1: Identify initial equilibrium
Initial equilibrium: $D_1$ intersects $S_1$ at $\text{Exchange Rate} = \$4$, $\text{Quantity} = 20$ million reals, within the $\$2-\$5$ band.
Step2: Analyze demand shift
Demand shifts right to $D_2$. Without intervention, $D_2$ and $S_1$ intersect above the $\$5$ ceiling.
Step3: Apply exchange rate ceiling
The currency stabilization fund enforces the maximum allowed rate of $\$5$ per real, so the new exchange rate is capped at this ceiling.
Step4: Locate new rate on graph
The new exchange rate is at the ceiling line ($\$5$) on the graph.

Snap & solve any problem in the app
Get step-by-step solutions on Sovi AI
Photo-based solutions with guided steps
Explore more problems and detailed explanations
The new exchange rate is $\$5$ per Brazilian real, marked at the intersection of the ceiling line ($\$5$) and the new demand curve $D_2$ (the grey star symbol placed at the $\$5$ exchange rate level on the graph).