QUESTION IMAGE
Question
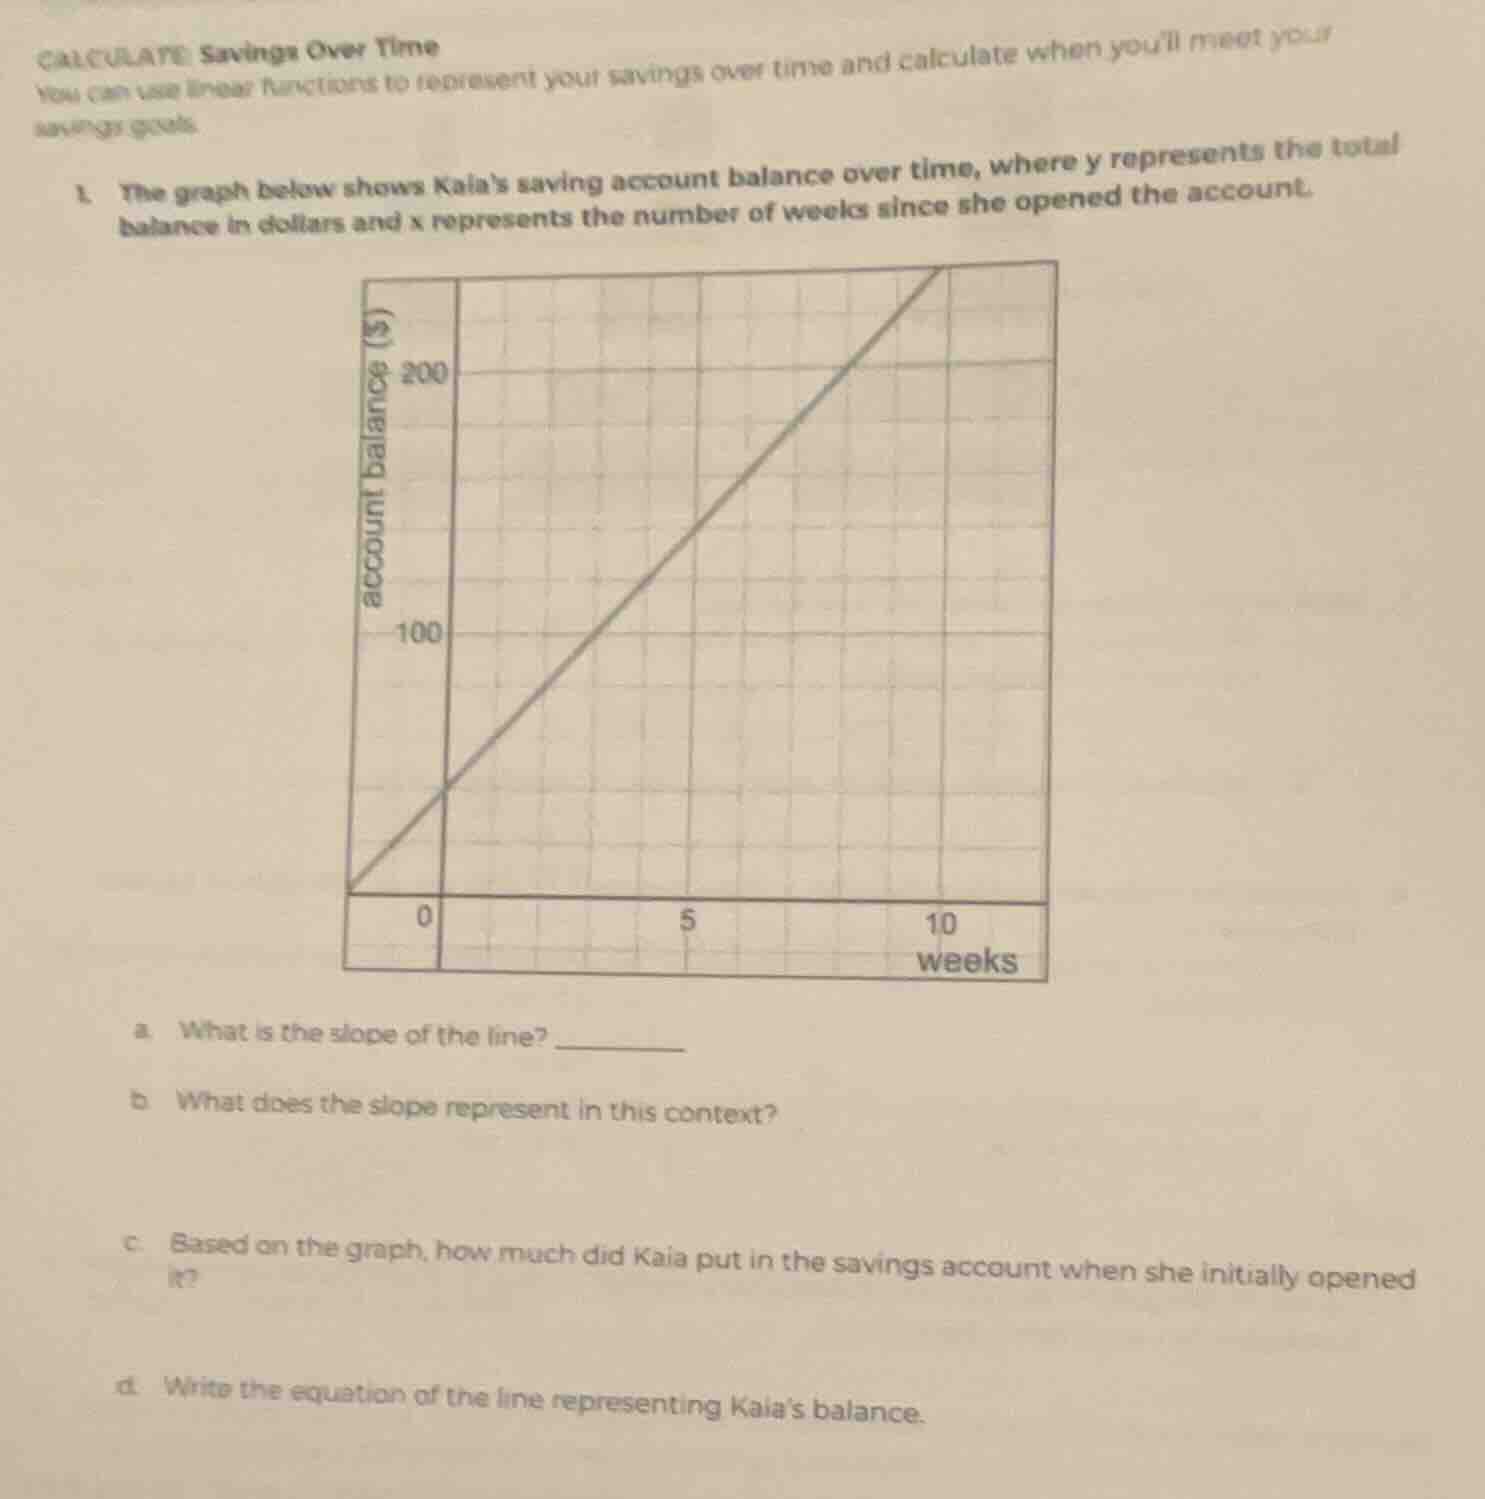
calculate: savings over time
you can use linear functions to represent your savings over time and calculate when youll meet your savings goals.
- the graph below shows kaias saving account balance over time, where y represents the total balance in dollars and x represents the number of weeks since she opened the account.
a. what is the slope of the line?
b. what does the slope represent in this context?
c. based on the graph, how much did kaia put in the savings account when she initially opened it?
d. write the equation of the line representing kaia’s balance.
Step1: Identify points for slope
Choose two points: $(0, 50)$ and $(10, 250)$
Step2: Calculate slope
Slope formula: $m=\frac{y_2-y_1}{x_2-x_1}$
$m=\frac{250-50}{10-0}=\frac{200}{10}=20$
Step3: Interpret slope context
Slope = change in y / change in x, so it's weekly savings.
Step4: Find initial deposit
Initial deposit is y-intercept (x=0): $y=50$
Step5: Write linear equation
Use $y=mx+b$, $m=20$, $b=50$
$y=20x+50$

Snap & solve any problem in the app
Get step-by-step solutions on Sovi AI
Photo-based solutions with guided steps
Explore more problems and detailed explanations
a. $20$
b. The amount Kaia saves each week (20 dollars per week).
c. $\$50$
d. $y=20x+50$