QUESTION IMAGE
Question
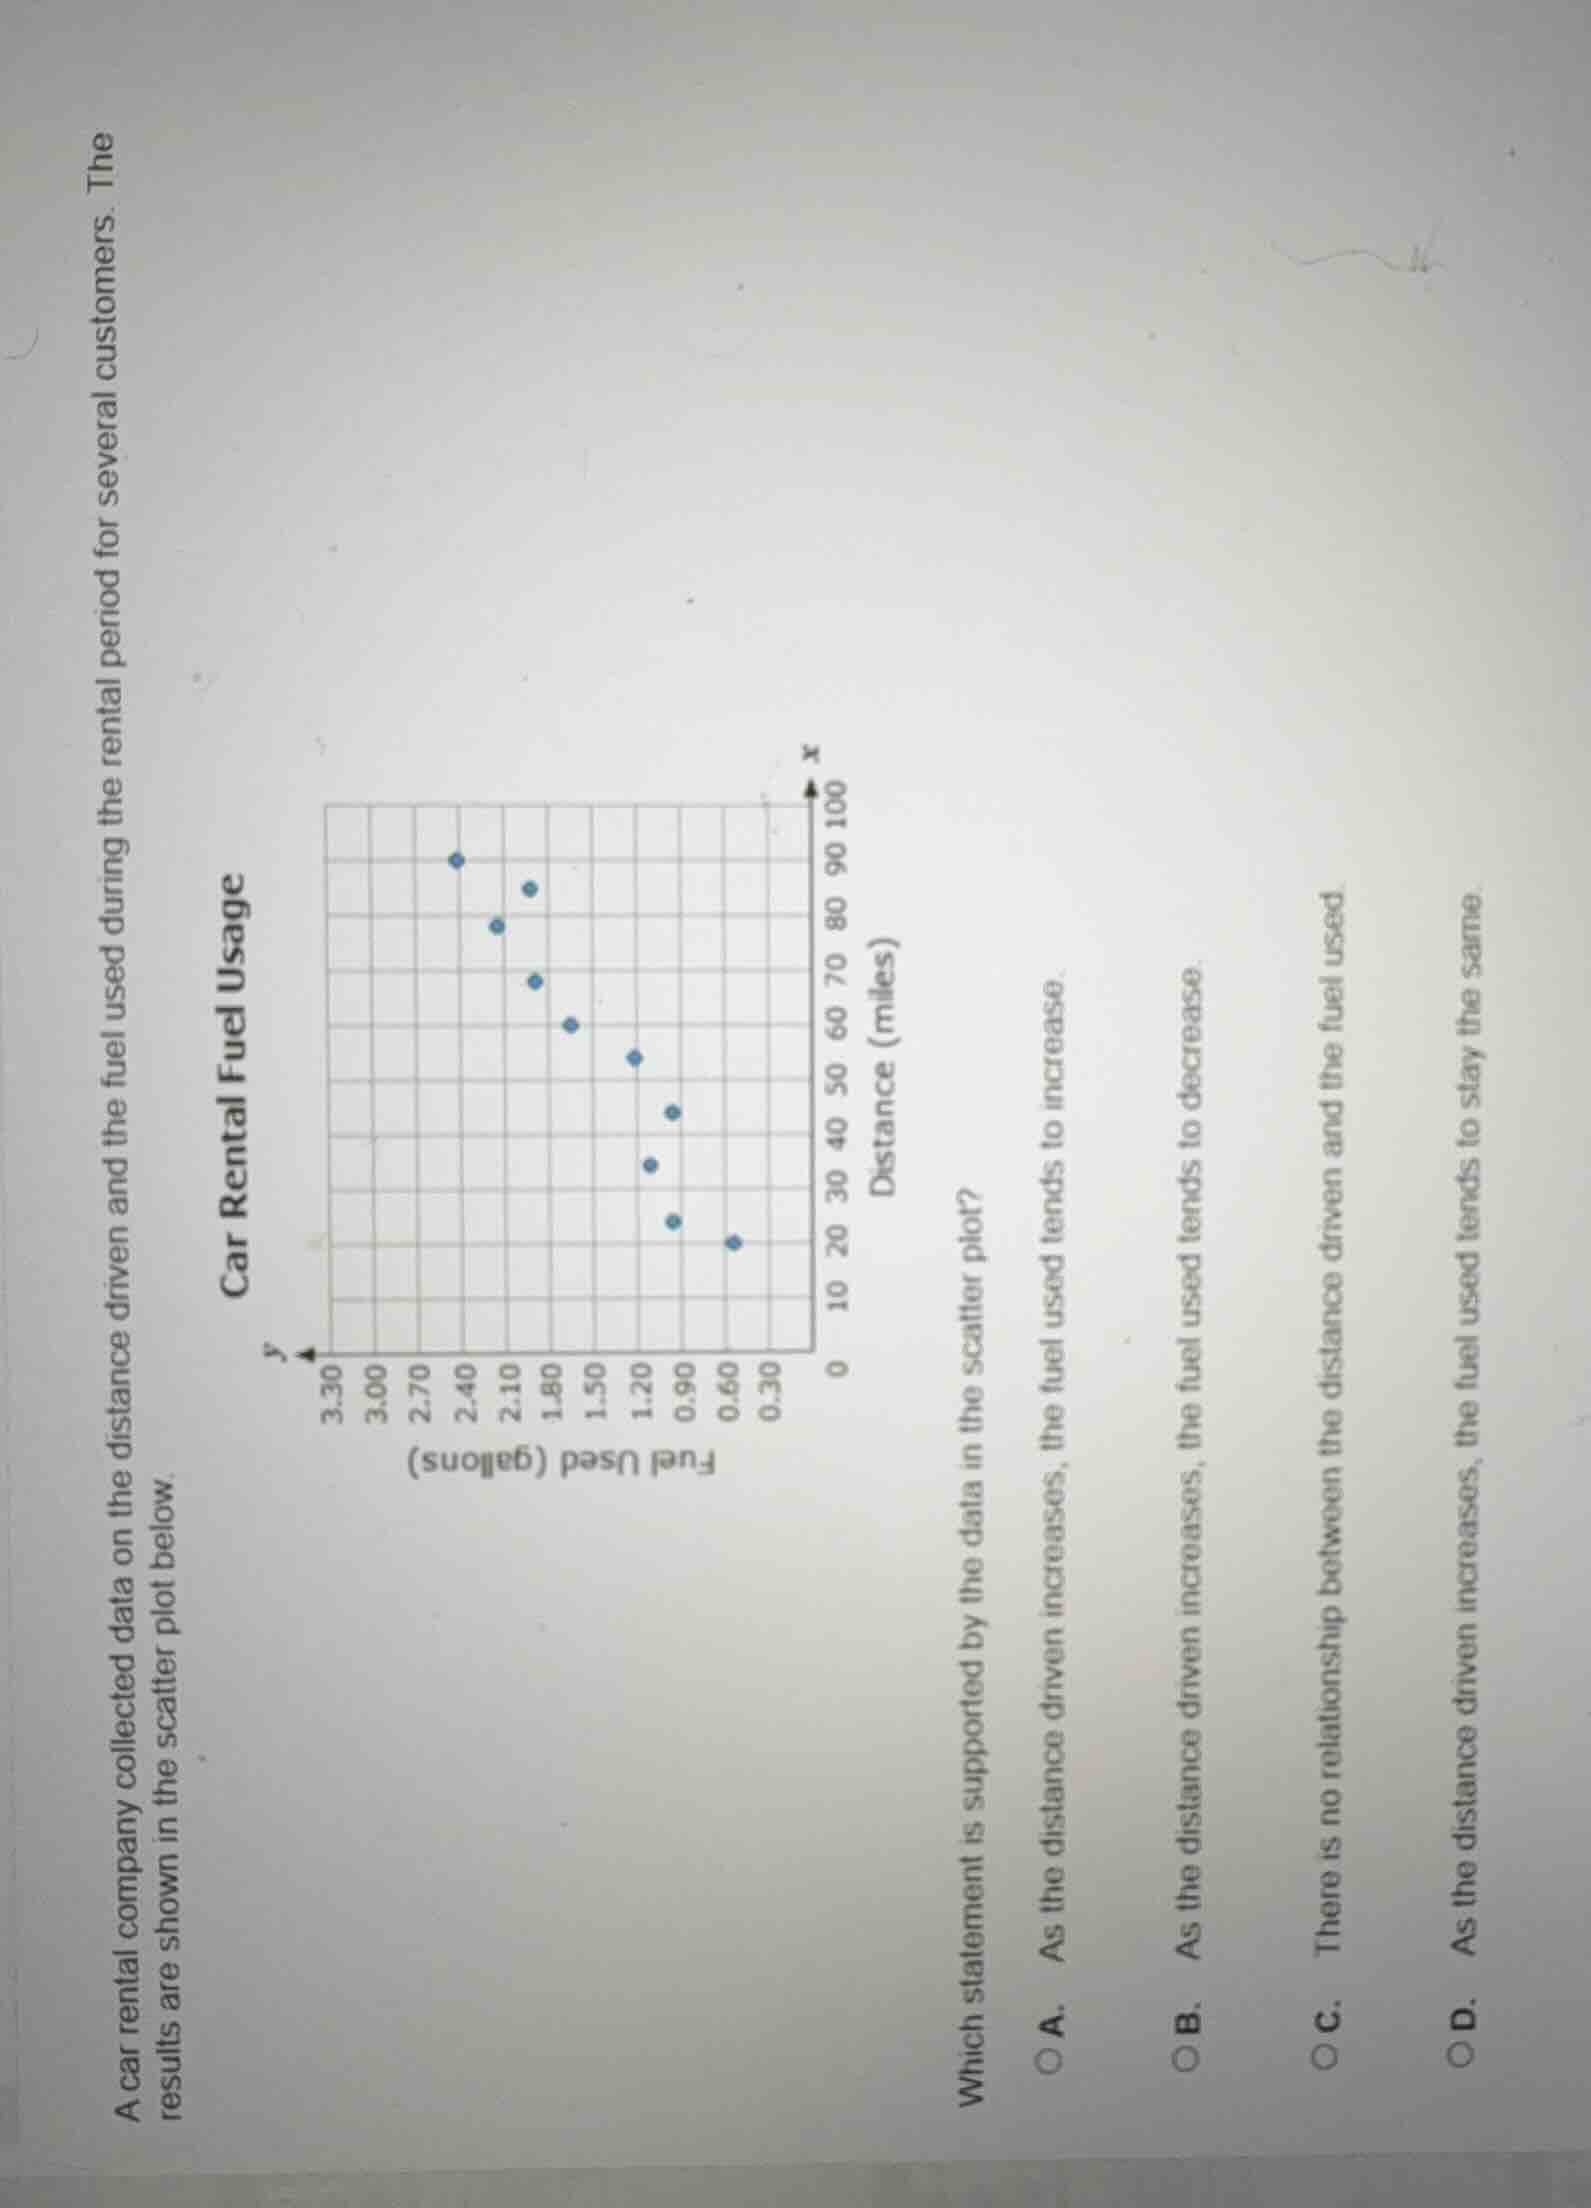
a car rental company collected data on the distance driven and the fuel used during the rental period for several customers. the results are shown in the scatter plot below. which statement is supported by the data in the scatter plot? a. as the distance driven increases, the fuel used tends to increase. b. as the distance driven increases, the fuel used tends to decrease. c. there is no relationship between the distance driven and the fuel used. d. as the distance driven increases, the fuel used tends to stay the same.
The scatter plot shows that as the x-value (distance driven in miles) increases, the y-value (fuel used in gallons) decreases. The data points trend downward from left to right, indicating an inverse relationship.

Snap & solve any problem in the app
Get step-by-step solutions on Sovi AI
Photo-based solutions with guided steps
Explore more problems and detailed explanations
B. As the distance driven increases, the fuel used tends to decrease.